As 2025 draws to a close, markets are navigating a period of extremely low technical liquidity, amplifying any potential surprise. This week is not about major directional moves, but rather the consolidation of year-end trends as investors prepare their books for January 2026.
Context: The Final Numbers of a Transitional Year
Recent data from official institutions paints the picture of a year defined by monetary policy normalisation and sluggish growth.
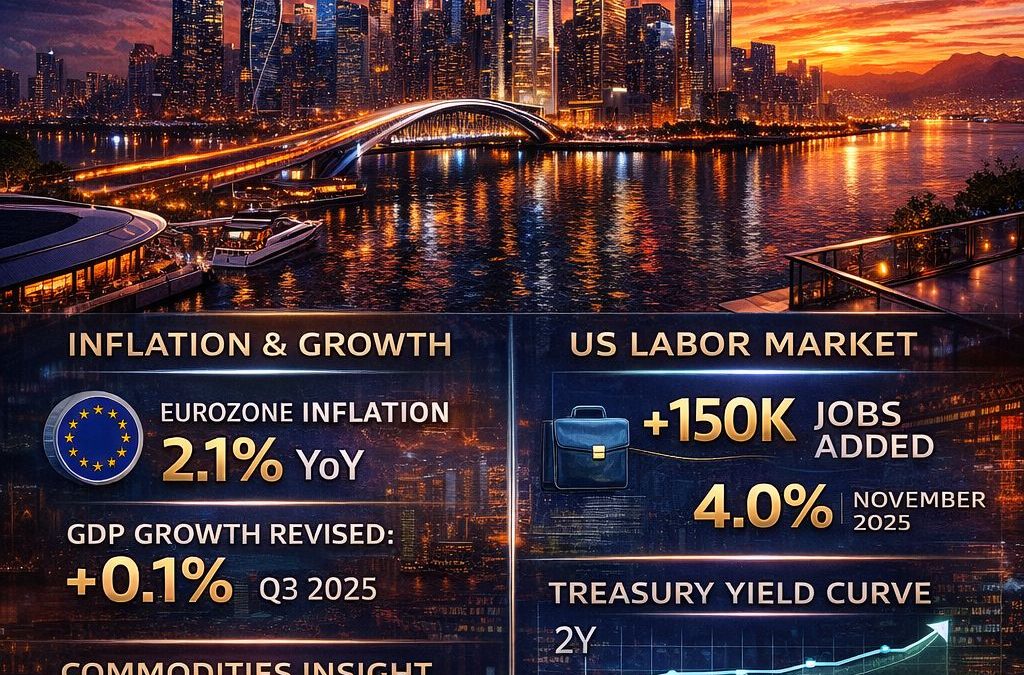
- Inflation and Growth in the Eurozone: The latest figures from Eurostat (published 18 December 2025) confirm that the Harmonised Index of Consumer Prices (HICP) settled at 2.1% in November 2025, reaching the ECB’s target. Q3 2025 GDP growth was revised down to +0.1% quarter-on-quarter, underscoring the fragility of activity.
- U.S. Labour Market: Data from the Bureau of Labor Statistics (BLS) for November 2025 (published 6 December) showed moderate job creation (+150k) and a steady unemployment rate of 4.0%, supporting the “soft landing” narrative.
- Federal Reserve Outlook: The Fed’s latest Summary of Economic Projections (SEP) (17 December 2025) maintained the trajectory for three rate cuts in 2026 but slightly revised up medium-term unemployment forecasts.
1. Equity Markets: A Technical Pause Before the January Rebalancing
Against a backdrop of extremely low trading volumes (traditional for this period), global indices (MSCI World) are likely to lack clear direction.
- Focus on Market Liquidity: The VIX (volatility index) and its European equivalent, the VSTOXX, are at annual lows, reflecting a degree of complacency. However, market depth (measured by order books) is historically thin at year-end, according to data from trading platforms like Refinitiv. A minor event could therefore trigger a technical amplification of price movements.
- Practical Insight: Prepare for the 2026 “January Effect.” Academic studies, such as those in the Journal of Financial Economics, have historically documented a tendency for small-cap and underperforming stocks to outperform in January, following tax-loss harvesting in December. This week, institutional investors may begin discreetly positioning their flows to anticipate this phenomenon, which could provide imperceptible, underlying support to certain market segments.
2. Rates Markets: The Yield Curve Awaits Its Next Catalyst
Government bond yields have found a temporary equilibrium following December’s policy announcements.
- The Signal to Decipher: The US 2s10s Spread. The spread between 2-year and 10-year Treasuries, published in real-time by the U.S. Department of the Treasury, has widened slightly since the Fed meeting, moving from -30 to -25 basis points. Continued widening (a less inverted curve) would be interpreted as a signal of growing confidence in avoiding a recession.
- Technical Risk: U.S. Treasury Auctions. The U.S. Treasury has scheduled auctions of 4-week and 8-week Treasury Bills this week. In an illiquid market, the demand, as measured by the bid-to-cover ratio, will be scrutinised. Weak demand could trigger technical upward pressure on very short-term yields.
3. Commodities: Physical Data Versus Financial Positioning
- Oil (Brent, ~$82-85): The latest report from the International Energy Agency (IEA) (13 December 2025) highlighted robust non-OPEC+ production growth (United States, Brazil, Guyana), offsetting voluntary cuts. Data on U.S. crude stocks from the EIA (published 24 December) showed a slight but unexpected drawdown. The tension between ample supply and inventories resisting a build is keeping prices in a range.
- Gold (~$2,180-2,220): The metal is in a consolidation phase. Physical flows tracked by the World Gold Council show sustained central bank purchases (notably from emerging markets) in 2025. However, the absence of immediate inflationary pressure limits speculative momentum. Its price currently reflects a balance between long-term institutional demand and a stable U.S. dollar.
4. Key Parameter to Watch: Money Market Fund Flows
The only truly significant high-frequency data this week will come from the Investment Company Institute (ICI). Its weekly data on net flows to U.S. money market funds is a leading indicator of risk aversion. After several weeks of massive capital inflows (seeking safety and yield in short-term instruments), any slowdown or reversal of these flows could signal that investors are preparing to become more offensive in equities in early 2026. This would be a discrete but tangible positive signal for risk assets.
5. The Underlying Theme for 2026: Corporate Profitability Versus the Cost of Capital
The most reliable indicator for anticipating 2026 is not a single data point from this week, but a trend validated by data from central banks and national statistical agencies: the spread between the cost of capital (WACC) and the return on invested capital (ROIC) is narrowing globally. Companies that maintain a high and stable ROIC in this context (often global leaders with durable competitive advantages) are those whose valuation premium will strengthen in 2026. This week is an opportunity to identify these assets, away from the media noise.
Strategic Conclusion: Serenity and Preparation
- Do Not Overinterpret Low-Volume Moves: This week’s volatility will be primarily technical and devoid of fundamental significance.
- Analyse Flows, Not Prices: Monitor ICI data on money fund flows and order book depth to detect early signals of repositioning.
- Consolidate and Rebalance: Use this calm period to rebalance portfolios towards the criteria that will matter in 2026: balance sheet quality, cash flow visibility, and durable competitive advantage (ROIC > WACC).
- Anticipate the January Restart: Prepare for a potential resumption of liquidity and activity from 2 January 2026, which could materialise the trends outlined at year-end.
The week of 29 December 2025 is not a thrilling chapter, but it is the title page for the year 2026. Astute investors will use it to re-examine the fundamentals and quietly position their outlook for the markets to come.
Sources:
- Eurostat (Statistical office of the European Union): Latest publications on inflation (HICP) and GDP growth in the euro area.
- U.S. Bureau of Labor Statistics (BLS): Employment Situation Report for November 2025.
- Board of Governors of the Federal Reserve System (Fed): Summary of Economic Projections (SEP) of 17 December 2025 and interest rate data.
- Refinitiv (London Stock Exchange Group): Data on market liquidity, order book depth, and trading volumes.
- U.S. Department of the Treasury: Daily data on Treasury yields (including the 2s10s spread) and auction schedule.
- International Energy Agency (IEA): Oil Market Report, December 2025.
- U.S. Energy Information Administration (EIA): Weekly Petroleum Status Report.
- World Gold Council: Quarterly data on gold demand, including central bank purchases.
- Investment Company Institute (ICI): Weekly estimated data on money market and equity fund flows.
- National Central Banks and Statistical Agencies (e.g., INSEE, Destatis, ONS): Data on corporate results, margins, and wage costs, enabling the calculation of ROIC and WACC by sector.
Important Disclaimer: The content of this article is provided for informational and educational purposes only. It reflects the author’s opinion based on information available at the time of publication, which may become outdated. This content does not constitute personalized investment advice, a recommendation to buy or sell, and does not guarantee future performance. Markets carry a risk of capital loss. The investor is solely responsible for their decisions and should consult an independent professional advisor before any transaction. The publisher disclaims all liability for decisions made based on this information.