A global strategic reading of financial markets and commodities
At the start of the week of 13 April 2026, markets are no longer being driven by monetary policy alone. The more important shift is that the disinflation trend seen through much of 2025 has collided with a renewed energy and logistics shock, and that shock is now shaping the outlook for currencies, bonds, equities, commodities, and food markets alike. This is the central fact of the week.
The macro backdrop: disinflation has slowed, energy is back at the centre
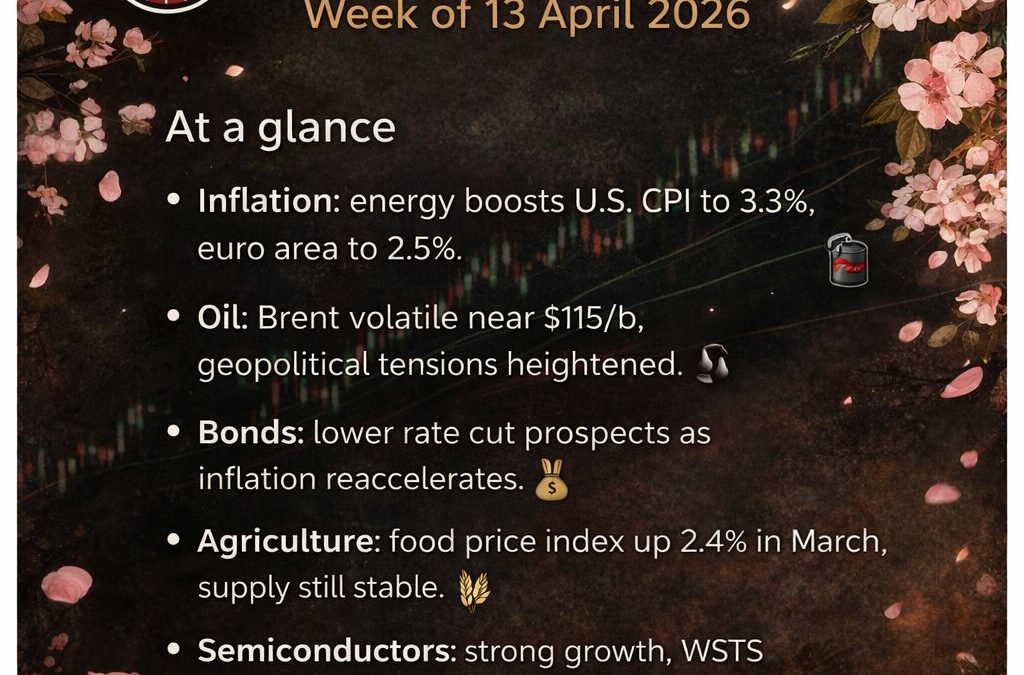
In the United States, the March 2026 CPI release showed headline inflation at 3.3% year-on-year, up from 2.4% in February, while core CPI stood at 2.6%. The most striking component was energy: the energy index rose 12.5% year-on-year, and gasoline prices jumped 21.2% month-on-month in March. Food inflation was more contained at 2.7% year-on-year, but the broader message was unmistakable: inflation is no longer easing smoothly, because energy has re-entered the picture in force.
The euro area tells a related, though not identical, story. Eurostat’s flash estimate put March 2026 inflation at 2.5%, up from 1.9% in February. Energy was the main driver, at 4.9% year-on-year, ahead of services at 3.2%, while non-energy industrial goods remained subdued at 0.5%. This matters because it suggests that the euro area’s renewed inflation pressure is not yet broad-based; it is still heavily linked to imported energy dynamics.
Central banks therefore remain cautious. On 18 March, the Federal Reserve kept the federal funds target range at 3.50% to 3.75%. On 19 March, the ECB left its key rates unchanged, including the deposit facility rate at 2.00%. In the ECB’s March 2026 staff projections, headline inflation is expected to average 2.6% in 2026, 2.0% in 2027, and 2.1% in 2028. The IMF’s latest confirmed global forecast available before 13 April (the January 2026 update) projects world growth at 3.3% in 2026 and 3.2% in 2027. The implication is straightforward: growth is still holding up, but the energy shock has made rapid monetary easing less likely.
Currencies: the dollar remains the pivot
In this environment, foreign exchange once again becomes a core macro transmission channel. The dollar retains two powerful supports: relatively high real rates and safe-haven status in periods of geopolitical or energy stress. That is especially relevant for emerging markets, because economies that import energy or carry significant dollar liabilities are more vulnerable when oil, shipping, and financing costs rise together. UNCTAD has explicitly warned that disruptions around the Strait of Hormuz can weaken currencies and raise external financing pressures across developing economies.
This matters for all asset classes. Commodities are priced largely in dollars, so any renewed dollar strength tightens financial conditions globally and amplifies the impact of higher raw-material prices on emerging markets. In other words, oil shocks do not stop at the energy complex; they move rapidly into FX, then into capital costs, then into equities and sovereign risk.
Equities: resilient, but increasingly selective
Equity markets have not broken down, but their resilience is becoming narrower and more conditional. In the United States, technology and AI-linked names still provide leadership, supported by digital infrastructure spending and structurally strong semiconductor demand. Yet that strength coexists with greater sensitivity to discount rates, oil prices, and earnings quality. This is no longer a market lifted broadly by hopes of rate cuts; it is a market that rewards balance-sheet strength, pricing power, and sector positioning.
In Europe, the picture is more rotational than euphoric. Energy, materials, and selected value sectors tend to perform better when inflation risk is repriced upward. That makes the internal structure of the market more important than the headline index level. The key issue now is not whether equities can still rise, but whether leadership remains too concentrated and therefore more fragile than index performance suggests.
Bonds: the case for a fast easing cycle has weakened
Bond markets are now dominated by one question: whether the energy shock is temporary enough to allow disinflation to resume quickly. For now, both the Fed and the ECB remain data-dependent, and the latest inflation prints make an aggressive easing narrative harder to sustain. That does not necessarily imply a new tightening cycle, but it does mean that long-duration assets remain exposed to renewed inflation surprises. The likely bond-market regime is therefore one of carry returning in importance, but with continued sensitivity to inflation-linked repricing.
Oil: the centre of gravity this week
Oil is the single most important market for this week’s outlook. According to the U.S. Energy Information Administration, Brent averaged $103 per barrel in March 2026. The EIA now expects Brent to peak at $115 per barrel in Q2 2026 before easing, assuming disruption gradually abates, and it expects prices to fall below $90 per barrel in Q4 2026, averaging $76 in 2027.
The IEA is more demand-focused. In its March 2026 Oil Market Report, it cut expected 2026 global oil demand growth to +640 kb/d, down 210 kb/d from the previous month, citing higher oil prices, weaker economic prospects, and disruption in the Middle East. OPEC is materially more constructive, continuing to project +1.4 mb/d of demand growth in 2026. That gap between the IEA and OPEC is important: it reflects two competing narratives in oil, one centred on demand destruction, the other on global resilience.
The more profound issue, however, is physical infrastructure. The EIA notes that if disruption persists, shut-in production could still amount to 6.7 mb/d in May before gradually recovering. UNCTAD has warned that shipping through Hormuz has fallen by more than 95%, disrupting not just crude flows but also gas and fertilizer routes. This is why the oil story is no longer simply about upstream production: it is about refining, transport, LPG, petrochemicals, and downstream costs across the global economy.
The oil industry: strong cash flows, but operational uncertainty
For the oil industry, high prices support revenues and free cash flow, but the key issue is operational normalisation. The EIA expects U.S. crude oil production to average 13.51 million barrels per day in 2026, rising to 13.95 mb/d in 2027, which confirms that the United States remains a structural buffer for the global system. But even that does not fully offset a major transit shock around Hormuz in the near term. For integrated majors, the environment is supportive for earnings; for refiners and downstream operators, the outlook is more complex because margins depend not just on crude prices but on physical availability, product spreads, and regional trade rerouting.
Industrial metals: less spectacular than oil, more strategic over time
Industrial metals tell a calmer but more structurally important story. The World Bank’s latest confirmed Commodity Markets Outlook tables available by this date project average 2026 prices of $9,800 per metric ton for copper, $2,600 for aluminium, $15,500 for nickel, $34,000 for tin, and $2,750 for zinc. Its broader assessment is that metals and minerals should be broadly stable in 2026, with only modest index-level gains.
That should not be mistaken for weakness. It means that industrial metals are no longer behaving like a pure cyclical boom trade. Instead, they rest on a more durable floor created by constrained supply, electrification demand, grid investment, and digital infrastructure. In that sense, they are less dramatic than oil in the short run, but arguably more important to the medium-term industrial story.
Metallurgy: the overlooked industrial pressure point
Metallurgy deserves separate attention. When energy prices rise abruptly, energy-intensive processing industries in Europe come under immediate pressure. This is not merely a question of spot prices for copper or aluminium; it is about margins, competitiveness, and the ability of downstream industrial sectors to absorb input shocks. Metallurgy is where the interaction between energy, logistics, and industrial production becomes most visible. That is why, even when metals themselves are not the main headline market, they remain central to a serious industrial reading of the week.
Precious metals: the hedge remains intact
The World Bank projects average 2026 prices of $3,575 per ounce for gold, $41 for silver, and $1,275 for platinum. Those levels are consistent with an environment in which gold continues to function as a macro hedge against geopolitical, inflationary, and monetary uncertainty. What matters is not simply that gold is elevated, but that it remains firm in a world where energy is also repricing upward. That is a signal of broader macro risk repricing, not just isolated safe-haven demand.
Semiconductors: structurally strong, but no longer detached from the real economy
Semiconductors remain one of the clearest structural growth stories. WSTS forecasts the global semiconductor market at $975 billion in 2026, after strong growth in 2025, with memory and logic both expected to expand by more than 30% year-on-year. AI, data centres, and digital infrastructure remain the main drivers.
Yet the sector is no longer “above” the real economy. In a world where energy, shipping lanes, and geopolitics are once again central, semiconductors must be read not only as a technology sector but as a strategic industrial system. Their fundamentals remain strong, but their risk profile is increasingly geopolitical.
Agriculture: calm on the surface, deeper dependence underneath
The FAO Food Price Index averaged 128.5 points in March 2026, up 2.4% month-on-month. All major categories rose, which indicates that the latest move is not an isolated commodity shock but a broader transmission of higher energy and logistics costs into the food system.
Cereals
FAO’s cereals price index rose to 110.4 points in March, up 1.5% month-on-month. Global wheat prices increased 4.3%, driven by U.S. drought concerns and expectations of lower sowings in Australia due to higher fertilizer costs. Corn prices rose only 0.9%, because ample global supply still offsets part of the pressure, while rice prices fell 3.0% thanks to harvests, softer import demand, and exchange-rate effects. FAO also expects world wheat production in 2026 at 820 million tonnes, down 1.7% year-on-year but still above the five-year average. The World Bank’s annual 2026 forecasts put U.S. HRW wheat at $258/t, corn at $195/t, and barley at $174/t. The broad conclusion is that there is no immediate global shortage, but the cereal complex is becoming more exposed to fertilizers, fuel, and shipping routes.
Rapeseed and vegetable oils
For rapeseed, the clearest official lens is the vegetable oils complex. FAO’s vegetable oil index reached 183.1 points in March, up 5.1% month-on-month and 13.2% year-on-year. FAO explicitly notes that palm, soy, sunflower, and rapeseed oils all rose, with rapeseed supported in part by stronger expected biofuel demand as energy prices increased. That makes rapeseed one of the agricultural markets most directly linked to oil.
Sugar
Sugar was one of the sharpest movers. FAO’s sugar index rose to 92.4 points, up 7.2% month-on-month. FAO attributes much of this to expectations that Brazil would allocate more cane to ethanol production because of firmer crude prices. The World Bank’s annual 2026 forecast remains more moderate at $0.37/kg, which suggests that the short-term shock is strong even if the full-year average may still settle below current spikes.
Cocoa
Cocoa remains tight, though the latest official annual forecast from the World Bank points to $7.50/kg in 2026, after $8.00/kg in 2025. That is not a return to normality. It implies that, even with some moderation, cocoa remains at historically elevated levels and therefore highly sensitive to West African supply, weather, and logistics.
Meat
FAO’s meat price index reached 127.7 points in March, up 1.0% month-on-month and 8.0% year-on-year. The increase came mainly from pork, especially in Europe, and to a lesser extent beef, while poultry and sheep meat weakened. The World Bank’s 2026 forecasts place beef at $6.82/kg and chicken at $1.70/kg. Meanwhile, USDA has lowered its 2026 outlook for total U.S. red meat and poultry production, including lower pork output. That points to a meat complex where beef and pork are more sensitive to supply constraints, while poultry remains more dependent on feed efficiency and cost management.
Milk and dairy
FAO’s dairy price index rose to 120.9 points in March, up 1.2% month-on-month, though still 18.7% below its level a year earlier. FAO points to strength in skimmed milk powder, butter, and whole milk powder, while international cheese prices continued to fall in the EU. USDA has raised its 2026 U.S. all-milk price forecast to $20.50 per cwt, supported by stronger cheese and skim milk powder pricing. This is a more nuanced market than cereals or sugar: not a shortage story, but one of selective firming in industrial dairy segments.
ETFs: flows remain very strong, and that matters
The ETF market continues to absorb uncertainty without any visible retreat. According to the Investment Company Institute, U.S. ETF assets reached $14.21 trillion in February 2026, up from $13.90 trillion in January and $10.69 trillion a year earlier. Net issuance was $184.7 billion in February alone, bringing year-to-date net issuance to $337.3 billion. Domestic equity ETFs accounted for $8.84 trillion, international equity ETFs $2.51 trillion, bond ETFs $2.39 trillion, and commodity ETFs $422.9 billion. The significance is not merely that assets are growing, but that flows continue into equities, bonds, and commodities simultaneously. Investors are no longer expressing one macro view; they are hedging across several.
Crypto: maturing, but still liquidity-sensitive
Crypto assets continue to institutionalise, though they remain sensitive to global liquidity and regulation. The SEC has continued to clarify how federal securities laws apply to certain crypto-asset activities, and that reduces some legal uncertainty even as it does not remove volatility. For markets, the key point is that crypto no longer lives in a separate speculative silo. It now responds to the dollar, ETF flows, rate expectations, and regulatory shifts much more like a mainstream risk asset.
Logistics: the most underestimated transmission mechanism
Logistics is no longer a background issue; it is a macro variable. UNCTAD warns that disruption around Hormuz has sharply increased risks for freight, fertilizer, and food. It also notes that high and volatile shipping costs risk becoming part of the new normal. That matters because transport costs feed directly into energy, food, industrial inputs, and therefore inflation. The oil, freight, and supply-chain stories are now one story.
ESG and sustainable finance: scrutiny has replaced slogans
In sustainable finance, the era of loose terminology is ending. ESMA’s guidance on the use of ESG and sustainability-related terms in fund names is designed to reduce greenwashing and improve investor protection. The FCA has also published updated examples of good and poor practice under the UK Sustainability Disclosure Requirements regime, with the explicit aim of improving trust and transparency in sustainable investment labels and disclosures. In practice, this means that ESG capital is still available, but much less tolerant of vague or weakly evidenced claims.
Near-term outlook
The most defensible near-term view is one of high but not disorderly volatility. Oil remains the key market to watch: the EIA still sees Brent peaking near $115/b in Q2 2026 before easing if disruption fades, while the IEA warns that persistently higher prices will damage demand. In agriculture, FAO is not signalling immediate scarcity, but it is warning that higher energy and input costs are feeding into food markets. In industrial metals, the World Bank still points to firm 2026 averages for copper and gold. In semiconductors, WSTS remains strongly bullish. The central scenario is therefore neither collapse nor exuberance. It is a world in which growth still exists, but energy, shipping, and physical inputs are increasingly determining who wins and who loses.
Sources
- U.S. Bureau of Labor Statistics, March 2026 CPI.
- Eurostat, March 2026 flash inflation estimate.
- European Central Bank, 19 March 2026 policy decision and March staff projections.
- Federal Reserve, 18 March 2026 FOMC statement.
- EIA, April 2026 Short-Term Energy Outlook.
- IEA, March 2026 Oil Market Report.
- OPEC, Monthly Oil Market Report.
- FAO, March 2026 Food Price Index.
- WSTS, Autumn 2025 semiconductor forecast for 2026.
- UNCTAD, April 2026 Hormuz and trade disruption analysis.
- ESMA and FCA, ESG and SDR guidance
Important Disclaimer: The content of this article is provided for informational and educational purposes only. It reflects the author’s opinion based on information available at the time of publication, which may become outdated. This content does not constitute personalized investment advice, a recommendation to buy or sell, and does not guarantee future performance. Markets carry a risk of capital loss. The investor is solely responsible for their decisions and should consult an independent professional advisor before any transaction. The publisher disclaims all liability for decisions made based on this information.