A strategic global reading of markets, commodities, and physical risks
A week dominated by the sudden return of real-world risk
The week of April 27, 2026, opens on a global market no longer guided solely by rate expectations. The real driver is now more concrete: energy, logistics, maritime chokepoints, imported inflation, industrial supply chains, and food costs. It is this shift in the center of gravity (from monetary to physical) that makes this sequence particularly important.
The IMF, in its April 2026 World Economic Outlook, projects global growth of 3.1% in 2026 then 3.2% in 2027, assuming the Middle East conflict remains limited in duration and scope. It also specifies that global inflation is expected to rise modestly in 2026 before resuming its decline in 2027. This point is essential: global growth is not collapsing, but it is entering a zone where energy and logistics shocks can rapidly alter expectations.
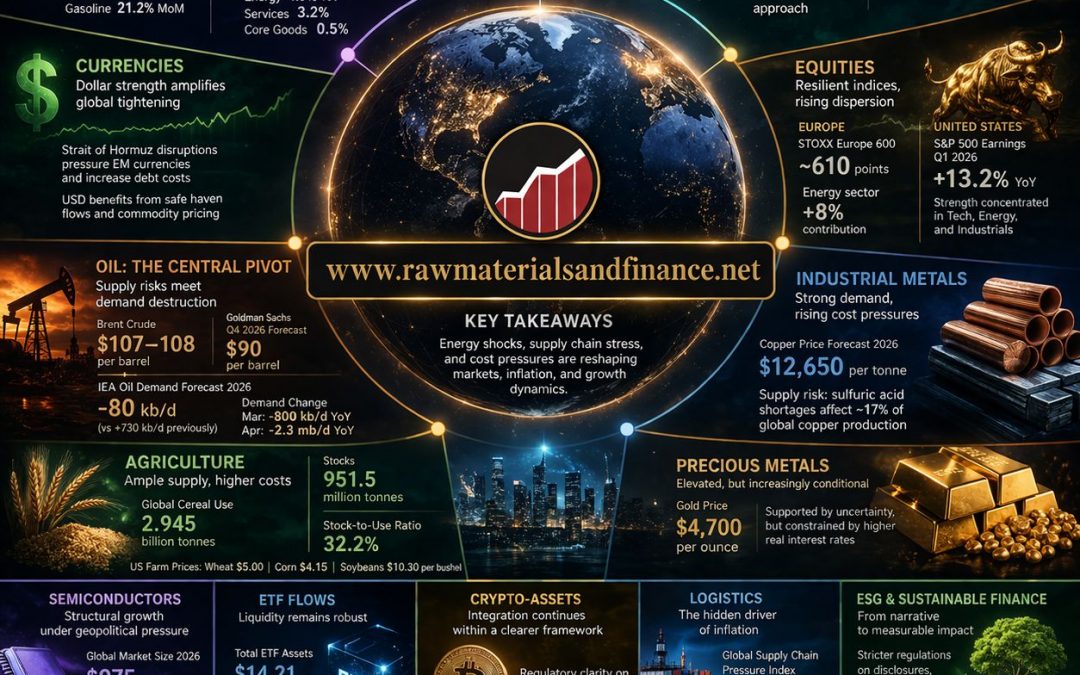
In the United States, the March CPI rose 3.3% year-over-year, with energy up 12.5% and gasoline rising 21.2% month-over-month, the largest monthly increase since the series began in 1967. In the eurozone, Eurostat confirmed annual inflation of 2.6% in March 2026, up from 1.9% in February, with energy as the main driver. The ECB, for its part, kept rates unchanged on March 19, with the deposit facility at 2.00%, and projects average inflation of 2.6% in 2026.
The market reading is therefore clear: disinflation has not disappeared, but it has become more fragile.
Central banks and bonds: the scenario of rapid rate cuts is receding
The Federal Reserve maintained its Fed funds target range at 3.50%-3.75% on March 18, stating that it would evaluate incoming data, the evolving outlook, and the balance of risks. The ECB, in the accounts of its March meeting published on April 16, indicates that the energy supply shock has significantly affected short-term inflation compensation in the eurozone, even if long-term expectations remain broadly anchored.
This nuance is crucial for bonds. The market has not necessarily returned to a regime of aggressive tightening, but it must incorporate a less comfortable reality: if oil remains high, central banks will find it harder to validate rapid rate cuts. Long maturities therefore remain vulnerable to inflation surprises, while short and intermediate maturities regain relative appeal due to their carry without this constituting an investment recommendation.
Currencies: the dollar becomes a shock-transmission instrument again
The foreign exchange market is once again central. In a context of high oil, maritime tensions, and central bank caution, the dollar retains its role as a safe haven and a billing currency for commodities. This mechanism particularly penalizes energy-importing economies and emerging markets indebted in dollars.
UNCTAD warns that disruptions around the Strait of Hormuz do not only affect energy: they can weaken currencies, weigh on equity markets, and increase the cost of external debt for developing countries. Currency risk thus becomes a macroeconomic variable, not simply a market variable.
Equities: apparent resilience, internal vulnerability
Equity markets remain solid on the surface, but the quality of this solidity must be questioned. The STOXX Europe 600 was trading on Monday around 610 points, after a 2.5% decline the previous week; the oil and gas sector strongly supported the index, with sectoral progress reported around 8%, while technology and consumer staples weighed more heavily.
In the United States, earnings season remains a supporting factor: according to FactSet, the consensus as of March 31 was for S&P 500 earnings growth of 13.2% year-over-year in the first quarter of 2026. But this strength coexists with increased vigilance on valuations, AI, and private credit; the Bank of England indicated in April that a substantial macroeconomic shock had increased risks to financial stability.
The conclusion is not that equities are weak; it is more subtle. Indices may remain high even as the internal rotation becomes more severe. Sectors that can pass on cost increases or benefit from energy are holding up better; those suffering from higher oil, freight, or input costs see their margins more exposed.
Oil: the market pivot of the week
Oil remains the core of this note. On April 27, Brent prices were reported above $107-108 per barrel, against a backdrop of stalled negotiations around the conflict with Iran and persistent tensions in the Strait of Hormuz. Reuters also indicates that Goldman Sachs raised its price forecasts for the fourth quarter of 2026 to $90 for Brent and $83 for WTI, while highlighting upside risks related to refined products and the magnitude of the supply shock.
Institutional data confirm the exceptional nature of the shock. In its April Oil Market Report, the International Energy Agency (IEA) now forecasts a decline in global oil demand of 80 kb/d on average in 2026, whereas it was still expecting growth of 730 kb/d in its previous report. The IEA also estimates that demand would have fallen by 800 kb/d year-over-year in March and by 2.3 mb/d in April, due to high prices and demand reduction or protection measures.
The EIA, in its April Short-Term Energy Outlook, simultaneously provides a U.S. framework: production, inventories, natural gas, coal, electricity, and renewables are tracked there within a logic of transition under constraint. The strategic point is that oil is no longer acting only as a financial price: it is becoming a physical cost that hits transportation, plastics, fertilizers, chemicals, consumer goods, and industrial margins.
Oil industry: the shock is not only upstream
The oil sector should not be read solely through the barrel price. Majors mechanically benefit from high prices, but refiners, petrochemicals, and transporters face a different reality: crude availability, shipping routes, insurance costs, refined products, LPG, and regional arbitrage.
Reuters reports that major global consumer goods groups are already under increased cost pressure: Procter & Gamble anticipates a $1 billion impact on its fiscal 2027 profits due to higher costs for packaging, logistics, and raw materials. This type of signal confirms that the rise in oil is spreading well beyond energy companies.
Industrial metals and metallurgy: the metal price is no longer enough
Industrial metals remain at the heart of the energy and digital transition, but analysis must now integrate processing costs. The World Bank reminds us that its monthly commodity price data (the Pink Sheet) tracks metals, energy, fertilizers, and agricultural products; the latest April 2026 edition therefore provides a verifiable price basis for these markets.
Copper deserves special attention. Reuters indicates that Goldman Sachs maintains a 2026 price forecast of $12,650 per tonne, while signaling a risk related to sulfuric acid shortages, an input necessary for certain production processes representing about 17% of global copper supply. The identified risks concern notably the DRC and Chile, two structuring regions for global supply.
European metallurgy, meanwhile, remains caught between two constraints: on one hand, structural demand linked to electricity grids, automation, and infrastructure; on the other, a heavier energy and logistics bill. So it is not just copper or aluminum that matters, but industry’s ability to process these metals without losing competitiveness.
Precious metals: gold remains high, but constrained by rates
Gold remains high, but its behavior is more complex than a simple safe-haven reflex. Reuters reports that on April 27, spot gold was trading around $4,704 per ounce, while U.S. June futures were retreating toward $4,720. The same factors that support gold like geopolitical risk, energy inflation, uncertainty, can also constrain it if central banks maintain higher rates for longer, because gold does not yield income.
Silver and platinum group metals remain more industrial in their reading: they combine a reserve function, electrification demand, and sensitivity to manufacturing activity. The message for this week is therefore nuanced: precious metals remain sought after, but they are not immune to a repricing of real rates.
Semiconductors: spectacular growth, but geopolitical
Semiconductors remain one of the few sectors where the industry forecast is frankly expansive. WSTS forecasts a global semiconductor market of $975 billion in 2026, with growth of over 25% , driven by memory and logic, themselves supported by artificial intelligence, data centers, and digital infrastructure.
But the sector can no longer be presented as a universe disconnected from the physical world. Energy, water, metals, maritime logistics, technological restrictions, and industrial sovereignty now determine its balance. The news that China blocked Meta’s acquisition of an AI company on national security grounds illustrates this rise in strategic control over the technology supply chain.
Agriculture: comfortable balances, but prices sensitive to energy
FAO indicates that its Food Price Index rose in March, due to higher energy costs linked to the Middle East conflict. The same press release states that world cereal utilization in 2025/26 is expected to rise by 2.4% to reach 2,945 million tonnes, while global cereal stocks are expected to increase by 9.2% to 951.5 million tonnes, with a stocks-to-use ratio of 32.2% . These are important figures: they signal a still comfortable global supply, but price tension fueled by energy, fertilizers, and transport.
For wheat, FAO forecasts 2026 world production of 820 million tonnes, down 1.7% year-over-year but still above the five-year average. The USDA, in its April 9 WASDE, indicates that U.S. wheat ending stocks are raised and the 2025/26 U.S. average farm wheat price is increased to $5.00 per bushel.
For corn and soybeans, the USDA raised season-average farm prices to $4.15 per bushel for corn and $10.30 for soybeans, while soybean stocks remain unchanged at 350 million bushels. This combination is interesting: balance sheets are not dramatically tight, but prices reflect higher input costs and greater weather/logistics risk.
Rapeseed must be read together with vegetable oils and biofuels. FAO reported in March a widespread rise in vegetable oils, including rapeseed oil, driven by biofuel demand and higher energy prices. This link is central: when oil rises, the food/energy arbitrage on oilseeds is reactivated.
Sugar also remains linked to energy: FAO indicated a rise in its sugar index in March, notably because higher oil makes ethanol more attractive in Brazil, which can divert more cane from sugar production to fuel. ICE data show that Sugar No. 11 contracts remain actively traded, confirming market depth.
Cocoa, after the extreme tightness of 2024-2025, shows signs of easing in futures, but remains exposed to logistics costs, fertilizers, and crop quality in West Africa. Market data available in late April indicates cocoa back above $3,500 per tonne after a rebound, which remains historically high even if far below previous peaks.
Meats and dairy are more nuanced. The USDA indicates that 2026 U.S. beef imports are expected at 5.790 billion pounds, nearly 6% higher year-over-year, supported by demand for lean meat. U.S. pork exports reached 574 million pounds in February 2026, versus 565 million a year earlier, up 1.6% . For dairy, April USDA data indicate a raise in the 2026 all-milk price forecast to $20.50 per cwt.
ETFs: flows confirm the search for liquidity
ETFs remain one of the best thermometers of global liquidity. The Investment Company Institute indicates that U.S. ETFs totaled $14.21 trillion in assets in February 2026. For the week ending April 15, net ETF issuances reached $39.13 billion.
This figure is essential: despite geopolitical volatility, flows are not massively leaving the market. Rather, they are seeking liquid, diversified, and adjustable vehicles. This explains why equity, bond, commodity, and thematic ETFs remain central to contemporary institutional allocation.
Crypto-assets: institutionalization, but dependence on financial conditions
Crypto-assets continue to institutionalize, but they remain liquidity and sentiment assets. The SEC published clarifications in March on the application of U.S. federal securities laws to crypto-assets, including a taxonomy of tokens and details on staking, airdrops, mining, and wrapping. The SEC also indicates that its Crypto Task Force aims to clarify the application of federal securities law to the crypto-asset market.
The analytical consequence is simple: crypto becomes more legally readable, but not necessarily less volatile. It remains sensitive to the dollar, real rates, ETF flows, and overall risk appetite.
Logistics: the hidden indicator of inflation
Logistics is probably the most underestimated factor of the week. The New York Fed’s Global Supply Chain Pressure Index rose to 0.68 in March, up from 0.54 in February, its highest level since early 2023, although it remains far below the peak of 4.49 reached in December 2021.
UNCTAD estimates that disruptions in the Strait of Hormuz have direct implications for energy, maritime transport, supply chains, currencies, and the cost of external debt for developing countries. The real risk is therefore not just a rise in oil; it is the transformation of the oil shock into a logistics shock, and then into a final price shock.
ESG and green finance: fewer slogans, more proof
Green finance remains central, but the environment has changed. ESMA has strengthened the criteria for using ESG and “sustainability” terms in fund names to limit greenwashing. In the UK, the FCA has published examples of good and bad practices on sustainable investment labels under the Sustainability Disclosure Requirements.
The decisive point is that ESG is not disappearing; it is hardening. Capital is increasingly moving toward issuers able to demonstrate data quality, consistency of their climate trajectory, and governance robustness. In a world where energy is becoming expensive again, the transition is no longer a moral discourse: it becomes an economic security issue.
Emerging markets: asymmetry returns
Emerging markets cannot be treated as a homogenous block. Energy and commodity exporters may benefit from high prices, but net energy importers suffer an immediate shock to their current account, currency, and inflation. UNCTAD stresses that developing countries are exposed to multiple financial effects: falling equities, weakening currencies, and rising external debt costs.
Asia remains driven by semiconductors and the digital industry, Latin America by commodities, while energy-importing economies are the most vulnerable. Country selection becomes more important than passive exposure to an emerging market index.
Cautious forecasts for the coming weeks
The most robust scenario is neither euphoria nor collapse. It is high volatility, but structured around a few verifiable axes: oil, inflation, rates, logistics, and corporate earnings.
The IEA now forecasts an average contraction in global oil demand of 80 kb/d in 2026, while the EIA provides a market framework where energy remains central to electricity, gas, coal, and renewables prices. The IMF projects global growth of 3.1% in 2026, but subject to conditions of limited conflict. The FAO shows cereal balances still comfortable but sensitive to energy. WSTS forecasts a semiconductor sector near $975 billion in 2026. These four signals sum up the week: the global economy holds up, but it becomes much more dependent on its material constraints.
Conclusion: the return of the physical economy
This week’s note could be summarized as follows: financial markets can no longer be analyzed solely through rates, earnings, or liquidity. They must be re-read through shipping routes, inventories, refineries, fertilizers, energy, metals, and digital infrastructure.
The change is subtle but profound. In the 2010s, markets lived under monetary dominance. In 2026, they are rediscovering that finance rests on a material economy. That is where, this week, the true market signal lies.
Sources
- IMF, World Economic Outlook, April 2026.
- BLS, CPI, March 2026.
- Eurostat, eurozone inflation, March 2026.
- ECB, monetary policy decision and projections, March 2026.
- Federal Reserve, FOMC statement, March 18, 2026.
- IEA, Oil Market Report, April 2026.
- EIA, Short-Term Energy Outlook, April 2026.
- FAO, Food Price Index and Cereal Supply and Demand Brief, April 2026.
- USDA, WASDE and Livestock, Dairy and Poultry Outlook, April 2026.
- WSTS, semiconductor forecast, 2026.
- ICI, ETF data, February/April 2026.
- UNCTAD, analyses on Strait of Hormuz disruptions.
- New York Fed, Global Supply Chain Pressure Index.
- ESMA / FCA / SEC, ESG and crypto-regulation.
Important Disclaimer: The content of this article is provided for informational and educational purposes only. It reflects the author’s opinion based on information available at the time of publication, which may become outdated. This content does not constitute personalized investment advice, a recommendation to buy or sell, and does not guarantee future performance. Markets carry a risk of capital loss. The investor is solely responsible for their decisions and should consult an independent professional advisor before any transaction. The publisher disclaims all liability for decisions made based on this information.