A Global Economy Under Pressure: The End of the “Cheap Growth” Regime
Central thesis : The global economy is not collapsing, but it is entering a new macroeconomic regime in which the cost of stabilizing growth has increased structurally. Growth forecasts remain positive, but each percentage point of growth now demands more energy, more metals, and more logistical resilience. .
I. Global Macroeconomic Framework: Positive Growth, Asymmetric Risks
1.1 The IMF Revisions: A Multi-Speed World
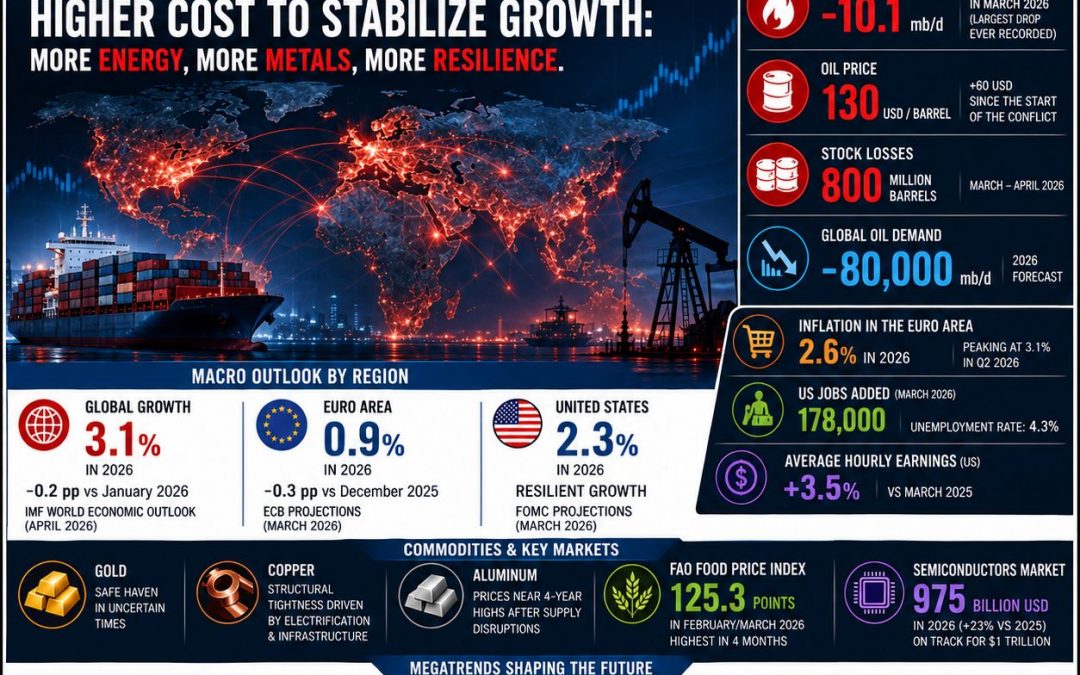
The International Monetary Fund published its World Economic Outlook in April 2026, which constitutes the indispensable reference for any global economic assessment. According to this document, global growth for 2026 is now projected at 3.1% , a downward revision of 0.2 percentage points from the January 2026 projections. This revision primarily reflects the impact of the escalating Middle East conflict on advanced economies and, even more so, on Middle Eastern and North African countries.
The breakdown by geographic region is particularly revealing. The United Kingdom experiences the largest revision among advanced economies (−0.5 points for 2026), followed by the euro area (−0.2 points). The revision for the United States, by contrast, is minimal (−0.1 point in 2026, with even a slight upward revision of +0.1 point in 2027). For emerging and developing economies, average growth is now expected at 3.9% in 2026 , down from 4.4% in 2025. What stands out is the dispersion of trajectories: some net energy-exporting Gulf countries are seeing their GDP contract, while other emerging economies benefit from favorable carry-over effects linked to the strength of activity in late 2025 and early 2026.
The most striking element concerns the Middle East and North Africa region, where growth is now expected at only 1.1% in 2026. Five of the eight hydrocarbon-producing countries of the Persian Gulf are expected to see their GDP contract to varying degrees this year. This revision is not a simple technical adjustment: it signals that the energy shock, far from being neutral for producers, also destroys value on the supply side when infrastructure is directly threatened.
1.2 The Euro Area Under Pressure: ECB Revision and Rising Inflation
The European Central Bank published its macroeconomic projections in March 2026, incorporating for the first time the full consequences of the Middle East conflict. The finding is clear: euro area growth for 2026 is revised down to 0.9% , a revision of −0.3 points from the December 2025 projections. This revision is directly attributed to the energy shock and the resulting uncertainty.
Inflation, measured by the Harmonized Index of Consumer Prices (HICP), is now projected at 2.6% on average over 2026 , up from 2.1% in 2025. The quarterly dynamics are even more telling: inflation is expected to reach 3.1% in the second quarter of 2026 , driven by surging energy prices, before falling back to 2.8% in the third quarter. This trajectory reflects the ECB’s central assumption: energy prices, according to futures contracts as of March 11, 2026, are expected to peak in the second quarter before gradually declining.
Data already published by Eurostat confirms this direction. Euro area annual inflation stood at 2.6% in March 2026 , exceeding the flash estimate of 2.5%. The monthly increase in consumer prices reached 1.3%, a pace not observed for several years. Energy’s contribution to this inflation is 0.48 percentage points , making it the second-largest contributor after services. On a monthly basis, energy prices jumped 7% in March.
What matters is not only the level but the structure of this inflation. Excluding energy, euro area annual inflation is only 2.3%. This means we are not in a scenario of generalized price drift, but in a pure energy supply shock with all the implications this carries for monetary policy (see Section II).
1.3 The US Case: Monetary Pause and Employment Resilience
The US situation presents an instructive contrast with the euro area. The Federal Open Market Committee maintained the federal funds target range at 3.50% – 3.75% on March 18, 2026 , marking the second consecutive pause after a series of 75 basis point rate cuts in the second half of 2025. The linguistic innovation is significant: the FOMC statement introduced the following phrase: “The implications of developments in the Middle East for the US economy are uncertain.”
This formulation reflects a classic dilemma for central bankers. A stagflationary shock simultaneously inflationary via energy supply and recessionary via uncertainty, is the most difficult configuration to manage. As BMO Economics notes, “it is easier to deal with either upside inflation risks or downside growth risks… but not both at the same time.” Governor Waller, who had previously voted for a rate cut, returned to the status quo camp, signaling that the FOMC majority currently favors caution.
The FOMC’s Summary of Economic Projections now anticipates total and core inflation at 2.7% year-over-year for 2026 , up 0.2 to 0.3 points from previous projections. Real GDP growth for 2026 is revised upward to 2.3% , reflecting some confidence in productive investment, particularly in AI and automation. Chairman Powell indicated that the Fed might be “more concerned” about current inflation risks given the past five years of exceeding inflation targets, a signal of caution suggesting the pause could persist.
The US labor market confirms this relative resilience. According to the Bureau of Labor Statistics report of April 3, 2026, the US economy created 178,000 jobs in March , with the unemployment rate stable at 4.3%. Job creation is concentrated in health care (+76,000), construction (+26,000), and transportation/warehousing (+21,000). Federal employment, by contrast, continues to contract (−18,000 in March), with a total decline of 355,000 jobs (−11.8%) since its October 2024 peak.
Average hourly earnings increased 3.5% year-over-year, while the average weekly work hours declined slightly to 34.2 hours. The decline in the participation rate and the increase in the number of discouraged workers (+144,000 in March to reach 510,000) suggest, however, that the US labor market is not as tight as the headline employment figures might suggest. For the analyst, this signal deserves attention: workers who leave the labor force are not counted in unemployment, but they represent a loss of productive capacity.
II. Monetary Policy Facing the Supply Shock: The Central Bank Dilemma
2.1 The ECB Between Alternative Scenarios
The ECB’s approach in its March 2026 projections is methodologically remarkable and deserves detailed analysis, as it reveals how the institution thinks about risk. Rather than providing a single forecast, ECB economists developed three alternative scenarios : a baseline scenario, an adverse scenario, and a severe scenario.
The baseline scenario relies on technical assumptions fixed on March 11, 2026, with an unusually short three-day observation window (compared to the usual ten days), due to extreme market volatility following the outbreak of the Middle East conflict. It assumes that oil and gas prices peak in the second quarter of 2026 (around $90 per barrel and €50 per MWh, respectively) before declining. In this scenario, inflation reaches 2.6% in 2026 and growth falls to 0.9%.
The adverse scenario assumes a more pronounced energy shock, with peaks at $119 per barrel and €87 per MWh in the second quarter of 2026. Inflation would then be 0.9 points higher in 2026 compared to the baseline scenario, while growth would be 0.4 to 0.5 points lower over 2026-2027.
The severe scenario is the most strategically instructive. It assumes oil prices at $145 per barrel and gas at €106 per MWh in the second quarter of 2026, with a much slower normalization. In this scenario, inflation would be 1.8 points higher in 2026, 2.8 points higher in 2027, and 0.7 points higher in 2028 compared to the baseline scenario. The gap between the adverse scenario (inflation at 1.6% in 2028) and the severe scenario (inflation at 2.8% in 2028) illustrates the extreme sensitivity of the inflation trajectory to the persistence of the energy shock.
These scenarios they constitute the analytical framework that financial markets use to evaluate assets. The 1.2 point difference in 2028 inflation between the two adverse scenarios translates into significant differences in long-term interest rate expectations. The ECB itself specifies that these scenarios are constructed “in the absence of any monetary or fiscal policy reaction beyond what is included in the baseline scenario”, in other words, they measure the pure impact of the shock, not the authorities’ response.
2.2 The Fed Dilemma: Wait or Act?
The Fed’s position is symmetric but distinct. The maintenance of rates at 3.50-3.75% reflects an assessment that risks are currently balanced. However, as BMO Economics notes, Chairman Powell indicated that “the Fed might be more concerned about current inflation risks” given the recent history of exceeding inflation targets.
This caution is all the more justified as the US economy benefits from a structural advantage that the euro area does not possess: relative energy independence. The Fed can therefore afford to wait for uncertainty to lift, while the ECB faces an imported supply shock over which it has no control. In central bankers’ language, the Fed faces a price shock , while the ECB faces a scarcity shock, and the difference is crucial for asset analysis.
III. The Energy Shock: Unprecedented Magnitude and Systemic Consequences
3.1 IEA Data: An Unprecedented Supply Collapse
The International Energy Agency’s monthly Oil Market Report, published in April 2026, contains data that alone justify a complete reassessment of the global economic situation. According to this document, global oil supply experienced a contraction of 10.1 million barrels per day (mb/d) in March 2026 , the largest disruption ever recorded.
This fall is massively concentrated in OPEP+ countries, whose production decreased by 9.4 mb/d month-on-month to reach 42.4 mb/d. Even non-OPEP+ countries saw their production fall by 770,000 barrels per day, as gains in Brazil and the United States did not offset losses in Qatar. The primary cause is the near-total halt of flows through the Strait of Hormuz: exports via this route fell to 3.8 mb/d in early April , down from over 20 mb/d in February.
Alternative routes have partially compensated for this shortfall. Exports transiting through Saudi Arabia’s west coast, Fujairah (UAE), and the Iraq-Turkey pipeline increased to 7.2 mb/d , up from less than 4 mb/d before the conflict. But this only partially compensates for the losses, and the IEA estimates that “the total loss of oil exports exceeds 13 mb/d.” Stock losses reached 85 million barrels in March, with an additional 440 million barrels expected in April (a cumulative loss of 800 million barrels over two months).
This supply shock has mechanically pushed prices upward. North Sea Dated crude was trading at around 130 USD per barrel at the time of the report′s publication, 60 USD higher than before the conflict. This is the largest monthly increase ever recorded in the oil market.
3.2 Consequences for Demand: A Symmetric Shock
The surprise is that this supply shock is already translating into demand destruction. The IEA revised its demand growth forecasts for 2026, moving from an expected increase of 730,000 barrels per day to a decline of 80,000 barrels per day . In real terms, demand already fell by 800,000 barrels per day in March compared to the previous year, and a further decline of 2.3 mb/d is anticipated for April.
This demand destruction is not uniform. It primarily affects Asian refiners and petrochemical companies, which have reduced operating rates due to supply shortages. It also affects households and businesses using LPG, as well as air transport, with flight cancellations in the Middle East, Asia, and Europe leading to a sharp fall in kerosene consumption.
This dual movement (supply contraction and demand destruction) creates an unstable market configuration, where high prices do not translate into sustained production increases because infrastructure is either damaged or inaccessible. For the commodity analyst, this means traditional supply-demand equilibrium models are temporarily invalidated: the market is now in a regime of physical disconnection , where price is no longer an efficient allocation signal but a reflection of strategic scarcity.
3.3 Integration with Other Commodity Markets
This oil dynamic is not isolated. It spreads across all commodity markets through three main channels.
The first channel is production and transport costs. As UNCTAD notes in its Review of Maritime Transport 2025, the Strait of Hormuz transports approximately one-quarter of global seaborne oil trade, but also significant volumes of LNG and fertilizers. Disruptions on this route therefore transmit directly to agricultural and industrial input costs. Global maritime trade grew by only 0.5% in 2025, with moderate projections for 2026-2030 at around 2.0% per year.
The second channel is industrial metals. Aluminum illustrates this transmission with remarkable clarity: strikes affecting major production sites in the Middle East have pushed prices to nearly four-year highs, in a context where the Gulf region accounts for approximately 9% of global smelting capacity and 18% of global exports outside China.
The third channel is agricultural prices. The FAO Food Price Index reached 125.3 points in February 2026, its highest level in four months, with increases in cereals, meats, and vegetable oils (see Section VI).
IV. United States: Employment Resilience, Activity Slowdown
4.1 Growth Slowing Without Tipping
The US macroeconomic picture is one of an economy that retains buffers but whose margins for maneuver are shrinking. According to the Bureau of Economic Analysis, annualized real GDP growth in the fourth quarter of 2025 was only 0.7% , down from 4.4% in the previous quarter. This clear deceleration in activity does not constitute a recession, but it signals that the engine of consumption, which represents approximately 70% of US GDP, is running out of steam.
March job creation (178,000) exceeded expectations, but its structure warrants examination. Health care (+76,000) and construction (+26,000) are the main contributors. However, these sectors are either less sensitive to cycles (health care) or benefiting from post-pandemic catch-up effects (construction). Conversely, federal employment continues to contract (−18,000 in March), with a total decline of 355,000 jobs (−11.8%) since its October 2024 peak. Finance and insurance also lost 16,000 jobs in March.
The labor force participation rate has declined, and total employment has increased only modestly over twelve months. The number of discouraged workers (those who have given up looking for work because they believe no jobs are available to them) increased by 144,000 in March to reach 510,000. This is a signal that the labor market is not as “tight” as the low unemployment rate (4.3%) might suggest.
4.2 Warning Signals
Caution is warranted on several fronts. First, credit is tightening. The Fed’s Senior Loan Officer Opinion Survey indicates tightening conditions for medium-sized businesses, the segment most exposed to credit cycles. Second, medium-sized business bankruptcies have been increasing for three months, according to S&P Global Market Intelligence. This signal is not yet visible in macroeconomic aggregates, but it is consistent with a late-cycle phase.
Finally, inflation expectations have adjusted upward since the start of the Middle East conflict. The University of Michigan survey shows a rise in 5-year expectations, a sign that households are incorporating the possibility of more persistent inflation. If this trend continues, it would constrain the Fed to keep rates higher for longer, which would weigh on consumption and investment.
V. Euro Area: The Downward Revision and Its Sectoral Implications
5.1 Growth Revised to 0.9%
The ECB’s March 2026 projections constitute the reference document for understanding the euro area trajectory. They incorporate for the first time the full effects of the Middle East conflict, with a methodology adapted to the urgency of the situation (reduced three-day observation window, cutoff date of March 11, 2026).
Growth for 2026 is revised down to 0.9% , compared to 1.2% in the December 2025 projections. This revision of −0.3 points is entirely attributed to the energy shock and the resulting uncertainty. The ECB notes that “energy price shocks and increased uncertainty will likely lead to more subdued consumption and investment.” This slowdown is considered temporary in the baseline scenario, subject to a rapid decline in energy prices.
Over the medium term, the ECB expects a recovery driven by domestic demand, a resilient labor market, and public infrastructure and defense spending – particularly in Germany. Forecasts for 2027 and 2028 are 1.3% and 1.4%, respectively. The gap between these forecasts and those of December 2025 is −0.1 point for 2027, and stable for 2028.
5.2 Inflation: An Energy Rebound, Not Generalized Drift
Inflation is the variable most directly affected by the conflict. HICP is now projected at 2.6% in 2026, up from 2.1% in 2025. The upward revision from the December 2025 projections is 0.7 points for 2026. As we saw with March Eurostat data, this increase is massively driven by energy, which contributes 0.48 points to annual inflation, while core inflation remains at 2.3%.
The quarterly projection is even more telling: 3.1% in Q2 2026, 2.8% in Q3, followed by a gradual decline in 2027 and 2028. This form of “inflation hump” is characteristic of a transitory supply shock in macroeconomic models. The ECB itself notes that “food inflation is expected to increase from late 2026, as cost pressures related to surging energy prices pass through to food prices.”
Wages are evolving more slowly. The ECB projects a slowdown in wage growth in the coming years, but at a slower pace than anticipated in earlier projections, due to compensation effects related to the energy shock. This is a point of attention: if wages begin to catch up with energy inflation, the risk of a price-wage spiral would materialize, making inflation more persistent.
5.3 National Divergences
The euro area is, of course, not a homogeneous space. According to Eurostat, annual inflation in March 2026 stands at 2.8% in Germany, 2.0% in France, 1.6% in Italy, and 3.4% in Spain. These differences reflect different energy structures (Spain being more exposed to gas than Germany, but benefiting from better interconnection with North Africa) and distinct policy supports.
The key question concerns sovereign spreads. Since the start of the Middle East conflict in late February 2026, rate differentials between German bonds (the “risk-free” reference) and Italian, Spanish, and even French bonds have widened. This movement signals that markets are beginning to differentiate among member states based on their energy exposure and fiscal sustainability. France, which lost its investment grade in May 2025, remains under surveillance.
VI. Agriculture: The Return of Systemic Food Risk
6.1 The FAO Index Rising
Agricultural markets are sending a more serious signal in April 2026 than meets the eye. The FAO Food Price Index (FFPI) reached 125.3 points in February 2026, its highest level in four months, after an upward revision of the January index to 124.2 points. The increase is 0.9% month-on-month, breaking a sequence of five consecutive monthly declines.
The category breakdown shows that the increase is driven by cereals (index at 108.6, up from 107.5 in January), meats (126.2, up from 125.2), and vegetable oils (174.2, up from 168.6). Dairy products (119.3) and sugar (86.2) declined slightly.
The first update for March 2026, published in early April, indicates stabilization at the same level (125.3). But it is the composition that matters: as the ECB notes in its projections, “food inflation is expected to increase from late 2026, as cost pressures related to surging energy prices pass through to food prices.” In other words, the peak in agricultural prices may still lie ahead, with a lag of a few months behind the peak in energy prices.
6.2 Transmission Channels
The transmission of the energy shock to agricultural prices operates through three distinct channels.
The first channel is fertilizers. Nitrogen fertilizer production is extremely energy-intensive (primarily natural gas). The rise in gas prices mechanically translates into higher fertilizer production costs, which weighs on agricultural yields or, failing that, on farmers’ margins.
The second channel is maritime transport. According to UNCTAD, disruptions in the Strait of Hormuz affect not only oil but also LNG and fertilizer flows. Route diversions and higher insurance costs pass through to imported agricultural product prices.
The third channel is drought or weather variability. The IEA and IRENA note that hydrological conditions remain a major adjustment variable for renewables, they are also a major adjustment variable for agriculture. A dry summer in Europe or in grain-producing regions (South America, Black Sea) could amplify price tensions.
6.3 Consequences for Net Importers
The return of food risk as a macroeconomic risk has differentiated consequences. For net food-importing countries (North Africa, the Middle East, some emerging Asian economies), this reactivates fiscal risks (food subsidies) and social risks (food riots). For Europe, which is largely self-sufficient in cereals but dependent on imports for oilseeds and animal proteins, the risk is more moderate but not zero.
For investors, this reinforces the relevance of segments related to irrigation, storage, resilient seeds, and agricultural data. Climate hedges (crop insurance, agricultural price derivatives) are also becoming relevant again after several years of relative calm in agricultural commodity markets.
VII. Industrial Metals, Precious Metals, and Semiconductors
7.1 Industrial Metals: Structural Tightness Confirmed
The underlying dynamic in industrial metals remains one of structural tightness. Copper, lithium, and nickel remain at the heart of electrification, batteries, and grid infrastructure. But in April 2026, the market rediscovers another essential fact: the physical security of certain strategic metals depends itself on a stable energy and geopolitical environment.
Aluminum illustrates this dependence with particular clarity. Strikes affecting major production sites in the Middle East have pushed prices to nearly four-year highs. This rise is not speculative: it reflects an effective reduction in supply in a context where the Gulf region accounts for approximately 9% of global smelting capacity and 18% of global exports outside China.
This situation raises a strategic question: should a permanent geopolitical risk premium be integrated into the valuation of metals produced in unstable zones? The answer depends on the anticipated duration of the conflict. The ECB’s severe scenario, which assumes oil prices at $145 per barrel and slow normalization, would imply structurally higher metal prices at least until 2028.
7.2 Precious Metals: Gold as a Safe Haven
Precious metals, and gold above all, express the hedging function in an uncertain environment. Gold remains sought after as a safe-haven asset when energy-driven inflation can re-emerge quickly and geopolitical shocks cloud interest rate expectations.
However, as BMO Economics notes, gold’s trajectory is no longer linear when the dollar strengthens or real yields rise. With the Fed maintaining rates at 3.50-3.75% and the dollar benefiting from safe-haven flows since the start of the conflict, gold must contend with a dual movement: rising demand for security, but rising opportunity cost of holding a non-yielding asset.
In this context, gold analysis requires a more granular approach than simply tracking spot prices. Three indicators should be monitored: flows into gold ETFs (indicator of institutional interest), central bank purchases (indicator of strategic diversification), and speculative positions on Comex (indicator of short-term sentiment).
7.3 Semiconductors: The Path Toward $1 Trillion
The semiconductor market remains one of the most readable for the analyst, because its fundamentals are driven by well-identified long-term trends (AI, data centers, electric vehicles). According to the World Semiconductor Trade Statistics, global semiconductor sales reached 795.6 billion in 2025, up 26.2795.6 billion in 2026, an increase of 23%.
What is striking is the progression toward the symbolic threshold of $1 trillion. Crossing this level, probably in 2027 or 2028, would make semiconductors an industry comparable in size to the global automobile industry. Demand is driven by data centers for AI (notably Nvidia GPUs and hyperscaler specialized circuits), 5G/6G communication infrastructure, and embedded electronics in vehicles.
However, this growth is not without risks. Strategic dependencies are multiplying. Nearly all advanced semiconductors are produced in Taiwan (TSMC) and South Korea (Samsung). Tensions in the South China Sea or a conflict around Taiwan would have immediate consequences for global chip supply. This is why semiconductors are ceasing to be a simple technological subsector to become an economic sovereignty infrastructure, on par with energy or water.
VIII. Artificial Intelligence: Productivity Accelerator and New Center of Risk Gravity
8.1 Key Figures from the Stanford AI Index 2025
Artificial Intelligence now deserves standalone treatment. The Stanford AI Index 2025, published by the Institute for Human-Centered AI, provides the reference data on the state of the industry.
According to this report, US private investment in AI reached 109.1 billion in 2024, nearly twelve times China′slevel. Generative AI attracted 33.9 billion globally. The United States dominates the production of notable AI models (40 models), followed by China (15 models) and Europe.
The diffusion of AI into the real economy is accelerating. The Stanford report indicates that 78% of organizations reported using AI in 2024, up from 55% a year earlier. This rapid progression signals that AI is no longer a sectoral promise reserved for tech: it is becoming a general-purpose technology for productivity reallocation, on par with electricity in the early 20th century or computing in the 1990s.
8.2 New Dependencies
But this build-up also opens new risks for the global economy. As AI diffuses, it reinforces dependence on three critical factors.
The first factor is advanced semiconductors. Nvidia’s GPUs and hyperscalers’ specialized circuits (TPUs, LPUs) are the hardware heart of AI. Their production depends on a few foundries in Taiwan and South Korea, with persistent bottlenecks in advanced packaging capacity (CoWoS at TSMC).
The second factor is electricity. Data centers training large language models consume considerable amounts of energy. The IEA, in its 2030 projections, notes that data center electricity demand could increase by 160% by 2030 in some scenarios.
The third factor is water and networks. Data centers require water for cooling and very high-bandwidth networks for interconnection. Water shortages in certain regions (Arizona, Chile, India) could therefore become a limiting factor for AI deployment.
8.3 Macroeconomic Analysis
The question is no longer whether AI is transforming the economy as it already is. The question is whether physical and energy infrastructure will keep pace. The answer is not obvious. The ECB’s severe scenario, with gas prices at €106 per MWh, would make operating data centers in Europe much more expensive than in the United States (where gas prices are less affected by the Middle East conflict).
This could lead to a new form of transatlantic divergence, where Europe accumulates a structural lag in AI not due to a lack of capital, but due to a lack of affordable energy. This is a hypothesis to incorporate into scenarios for 2027-2028.
IX. Fossil Energy and Renewable Energy: A Dual Dependence, Not Immediate Substitution
9.1 The Oil Shock in Numbers
We have already detailed above the magnitude of the oil shock according to the IEA: a supply contraction of 10.1 mb/d in March, prices at $130 per barrel, demand destruction already visible. These figures are unprecedented in the history of oil markets, including during the 1973 and 1979 shocks.
What is new about this shock is its multidimensional nature. It is not simply a price increase due to an OPEP decision to reduce production (classic 1970s shock). It is a physical destruction of infrastructure and a logistical blockage of a strategic strait. According to the IEA, stock losses will reach 800 million barrels in March-April, or more than 8% of annual global demand.
The crucial difference from previous shocks is that producer countries themselves are affected. Five of the eight Gulf countries are expected to see their GDP contract in 2026 according to the IMF. This means that the usual stabilization mechanisms (production increases by Saudi Arabia or the Emirates) are not working: infrastructure is either damaged or inaccessible.
9.2 Renewable Energy: Structural Growth
The contrast with renewable energy is striking, but one should not draw hasty conclusions. According to the IEA, global renewable electricity generation is expected to increase from 9,900 TWh in 2024 to 16,200 TWh in 2030, a 60% increase. Renewables are expected to surpass coal as the leading global electricity source by late 2025 or, at the latest, by mid-2026, depending on hydrological conditions. According to IRENA, global renewable capacity reached 5,149 GW in 2025, accounting for 49.4% of global electricity capacity.
These are impressive figures. But they do not mean that the world can do without oil or gas in the short term. The reason is simple: electricity represents only about 20% of final energy consumption. Transport (oil), heating (gas), and heavy industry (coal, gas) remain largely dependent on fossil fuels.
The other constraint is grids and storage. Renewables are intermittent (the sun does not shine at night, the wind does not always blow). Their massive integration requires considerable investment in transmission and distribution networks, as well as storage solutions (batteries, hydrogen, pumped hydro). These investments themselves are metal-intensive (copper, lithium, nickel) and land-intensive.
9.3 Dual Dependence, Not Instant Substitution
The reality is that the global economy is in a situation of dual dependence. It still depends massively on fossil fuels for uses where substitution is difficult (heavy transport, aviation, petrochemicals, fertilizers). But it already depends on renewable electricity for uses where substitution is advanced (lighting, appliances, digital).
The energy transition is not a “big bang” where we would switch from fossil to renewable overnight. It is a long-term process, requiring investment, time, and geopolitical stability. The current situation (an oil shock in the midst of an accelerating transition) will likely accelerate certain investments (notably in solar and batteries), but it will also make the persistent dependence on oil more painful.
X. Global Logistics and Strategic Raw Materials
10.1 Logistics Returns as a Strategic Asset
Global maritime trade, which transports more than 80% of international trade, has entered a phase of slower, costlier, and less redundant growth. According to UNCTAD, global maritime trade grew by only 0.5% in 2025, and projections for 2026-2030 remain moderate, at around 2.0% per year.
In the short term, the Strait of Hormuz shock has direct effects on logistics costs. Route diversions, surcharges, and rising insurance costs are increasing the total cost of trade. The IEA notes that exports via alternative routes have increased to 7.2 mb/d, but total export losses exceed 13 mb/d. In other words, there is a persistent deficit that cannot be filled by available capacity.
This situation has concrete consequences for companies importing raw materials. Lead times are lengthening, transport costs are rising, and flow predictability is deteriorating. In this context, logistics is once again becoming a component of economic security.
10.2 Defense and Critical Raw Materials
One sector less often addressed in conventional economic outlooks deserves particular attention: defense. According to SIPRI, the volume of international transfers of major arms increased by 9.2% between 2016-2020 and 2021-2025, with a strong surge in European demand. The United States now accounts for 42% of global major arms exports. Global military expenditure had already reached $2,718 billion in 2024, up 9.4% in real terms.
These expenditures have direct implications for commodity markets. The European Parliament noted in early 2026 that the European defense industry faces shortages of critical raw materials and semiconductors. The IISS recalls that European defense depends on secure supplies of strategic metals and materials. NATO has identified a list of 12 critical raw materials for defense.
Concretely, this means that rising defense spending supports not only defense equities, but also demand for aluminum (armor, structures), certain alloys (superalloys for turbojet engines), power electronics (semiconductors), energetic materials, and manufacturing capacities (machine tools, metal 3D printing).
10.3 Force Majeure Returns
Finally, this situation reactivates a legal and economic notion that had remained discreet since the Covid-19 pandemic: force majeure. Force majeure declarations or equivalent disruptions have affected energy flows and infrastructure linked to the Gulf.
For companies, this implies that four categories of risk must now be addressed together: disruption or delay in energy supply, lengthened logistics times, rising input costs, and activation of contractual clauses for suspension or renegotiation. Force majeure thus becomes a global economic risk again, no longer just a legal clause.
Sources
International Monetary Fund (IMF), World Economic Outlook (April 2026)
European Central Bank (ECB), Macroeconomic Projections (March 2026)
Eurostat, Flash estimate of inflation, March 2026
Federal Reserve (FOMC), Statement and SEP
Bureau of Labor Statistics (BLS), Employment Situation (March 2026)
International Energy Agency (IEA), Oil Market Report (April 2026)
UNCTAD, Review of Maritime Transport 2025
FAO, Food Price Index (February/March 2026)
World Semiconductor Trade Statistics (WSTS), Market forecast 2025-2026
Stanford HAI AI Index Report 2025
BMO Economics, FOMC announcement analysis
Anadolu Ajansı, Eurostat inflation and UNCTAD coverage
ThePrint, IEA Oil Market Report coverage
BNP Paribas EcoNews, IMF WEO analysis
Trading Economics, FAO Food Price Index data
Phoenix New Media / iFeng, WSTS semiconductor data
TechRepublic Stanford AI Index coverage
Important Disclaimer: The content of this article is provided for informational and educational purposes only. It reflects the author’s opinion based on information available at the time of publication, which may become outdated. This content does not constitute personalized investment advice, a recommendation to buy or sell, and does not guarantee future performance. Markets carry a risk of capital loss. The investor is solely responsible for their decisions and should consult an independent professional advisor before any transaction. The publisher disclaims all liability for decisions made based on this information.