A Strategic Forward-Looking Analysis of Financial Markets, Commodities, and Physical Risks
PART 1. ENERGY: THE LARGEST SUPPLY SHOCK EVER RECORDED
1.1 Situation at the Opening of the Week of May 18, 2026
According to the World Bank analysis published in May 2026, the Middle East conflict has caused the most severe energy supply crisis ever recorded, with 10 million barrels per day of oil lost in March. Prior to the conflict, vessels transiting the Strait of Hormuz accounted for nearly 35% of global maritime crude oil trade, 20% of refined petroleum product trade, and approximately 20% of liquefied natural gas (LNG) trade.
For the week of May 18 to 24, 2026, the situation is characterised by:
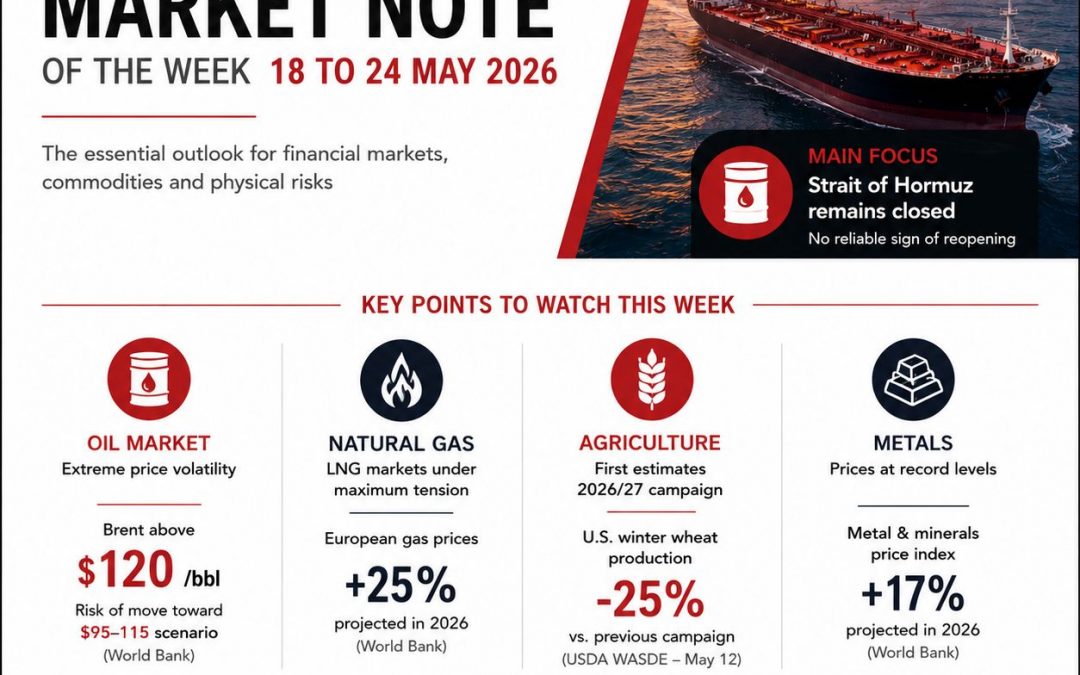
- De facto closure of the Strait of Hormuz: No reliable information allows for anticipation of a rapid reopening.
- Extreme price volatility: Brent reached 118/barrel at end March and exceeded 126/barrel in intraday trading at end-April.
- Gradual depletion of strategic stocks: The IEA has already announced a stock release of 400 million barrels.
1.2 2026 Price Forecast Ranges, World Bank Scenarios
| Scenario | Brent 2026 (average) | Underlying condition |
| Baseline scenario | $86/barrel | Strait reopens in May, return to near-normal by October |
| Prolonged disruption scenario | 95to95to115/barrel | Reopening beyond mid-2026, infrastructure damage |
Source: World Bank, May 2026
For the week of May 18, the working hypothesis must incorporate that the baseline scenario assumes a reopening “by May”, yet it is now May 18 and no reopening has been confirmed. The probability of a shift to the high scenario (>$95/barrel) has increased significantly.
1.3 EIA Forecasts : Short-Term Energy Outlook (May 12, 2026)
The EIA maintains forecasts for 2026-2027 that will require very rapid revision if the current situation persists:
| Indicator | 2026 (forecast) | 2027 (forecast) |
| Brent (USD/barrel) | 95 | 79 |
| US retail gasoline (USD/gallon) | 3.88 | 3.62 |
| US oil production (mb/d) | 13.6 | 14.1 |
| Henry Hub natural gas (USD/MMBtu) | 3.50 | 3.18 |
1.4 Natural Gas: Maximum Tension on LNG
According to the World Bank analysis of May 2026, European natural gas prices are expected to rise by approximately 25% in 2026, driven by disruptions to LNG supplies from the Middle East and infrastructure damage in Qatar.
Signal for the week: Asian and European LNG markets will remain under tension, with any additional disruption episode likely to trigger a further spike in spot prices.
1.5 Fertilizers: The Leverage Point to Monitor Absolutely This Week
The World Bank projects an increase of more than 30% in the fertilizer price index in 2026, driven by a 60% increase in urea prices. The fertilizer price index rose by more than 12% in the first quarter of 2026, reaching in March its highest level since 2022.
Mechanism of impact for the weeks ahead:
- High fertilizer prices reduce farmers’ purchasing capacity
- This leads to a potential reduction in cultivated areas and yields
- The effects materialise with a lag of 6 to 12 months
For the week of May 18, agricultural markets will progressively incorporate these expectations of lower future yields.
PART 2. AGRICULTURE: FIRST ESTIMATES FOR THE 2026/27 SEASON (USDA WASDE OF MAY 12)
2.1 Publication Calendar and Importance of the May 12, 2026 Release
The May 2026 WASDE report, published on May 12 at 12:00 PM ET, contains the first estimates for the 2026/2027 agricultural season. This is the most important report of the year for agricultural markets.
2.2 Key Data for the Week of May 18 (2026/2027 Season)
Wheat : Major bearish signal
- US winter wheat production: down 25% compared to the previous season
- This figure, derived from the first estimates of the May 12 WASDE, will constitute the main focus of market attention this week
Corn
- Planted area in the United States: 95.3 million acres (down 3.5 million)
- Projected production: 16 billion bushels (-6%)
- Ending stocks: down 185 million bushels
Soybeans
- US production: 4.435 billion bushels (+173 million)
- Biofuel use (soybean oil): 17.8 billion pounds (+3.6 billion)
- Ending stocks: 310 million bushels (-30 million)
2.3 FAO Trends : Confirmation of May 8, 2026
| FAO Index | Monthly change | Signal for the week |
| Vegetable oils | +5.9% | Highest since July 2022 / biofuel arbitrage active |
| Meat | +1.2% | Record high / limited livestock availability |
| Sugar | -4.7% | Only notable easing |
| Dairy | -1.1% | Only significant decline |
The April 2026 FAO Food Price Index, published on May 8, stands at 130.7 points, up 1.6% from March, the third consecutive month of increase.
PART 3. METALS AND MINERALS
3.1 World Bank Projections of May 2026
According to the analysis published in May 2026, the metals and minerals price index is expected to increase by 17% in 2026, reaching a record level.
By metal:
- Aluminium: projected increase of approximately 22% in 2026. The Gulf region is a key player in global supply.
- Copper: demand supported by emerging sectors (data centres, electric vehicles, renewable energies) in addition to traditional uses.
Signal for the week of May 18: Base metals will remain upwardly oriented, with increased sensitivity to any announcement concerning the reopening or prolongation of the Strait of Hormuz closure.
3.2 Precious Metals
The World Bank’s precious metals price index is expected to increase by 42% in 2026, the highest annual level ever recorded driven by geopolitical tensions and safe-haven demand.
For the week of May 18: Gold, silver, and platinum will remain supported. Any further rise in geopolitical tensions could trigger new price spikes.
PART 4. MACROECONOMIC RISKS AND GROWTH
4.1 Growth Forecast Revisions (EMDEs)
Before the conflict, emerging market and developing economies (EMDEs) were expected to grow by 4.0% in 2026. Projections have since been revised down to 3.6%, a decrease of 0.4 percentage points.
Signal for the week: This revision is now integrated into models. The week of May 18 will be marked by increased monitoring of leading indicators from emerging economies, particularly net energy importers.
4.2 Inflation Forecast Revisions (EMDEs)
Before the recent price shocks, GDP-weighted average inflation in EMDEs was projected at 4.1% in 2026. It is now expected at 5.1%.
Prolonged tension scenario: If disruptions persist and the average Brent price reaches $115/barrel in 2026, inflation in EMDEs could reach 5.8%, the highest rate since 2013, with the exception of 2022.
4.3 Food Insecurity (6-12 month risk)
According to initial World Food Programme estimates, if oil prices remain above $100/barrel for an extended period, an additional 45 million people could face acute food insecurity.
For the week of May 18, this risk is not yet materialised but must be incorporated into medium-term scenarios.
PART 5. EQUITIES, RATES AND BONDS: ABSENCE OF MAJOR PUBLICATIONS
No major institutional publication on equity markets, policy rates, or bond markets was released between May 7 and May 18, 2026, and none is scheduled for the week of May 18 to 24.
For the week of May 18, analysis of equity and bond markets will rely on:
- Central bank statements (Fed, ECB), no meetings scheduled this week
- Market indicators (indices, credit spreads, yield curves)
- Market expectations embedded in derivative products
PART 6. LOGISTICS AND SUPPLY CHAINS
6.1 Situation as of May 18, 2026
The World Bank indicates in its May 2026 analysis that the Strait of Hormuz accounted, before the conflict, for nearly 35% of global maritime crude oil trade, 20% of refined petroleum product trade, and 20% of LNG trade.
For the week of May 18, attention is focused on:
- Alternative routes (limited capacity, significantly higher costs)
- Maritime insurance premiums (rising for all vessels transiting near the conflict zone)
- The cascade effect on all goods (higher freight costs affect all imports, not just energy)
PART 7. CRYPTO-ASSETS
No major institutional publication on crypto-assets was released between May 7 and May 18, 2026.
For the week of May 18, crypto-assets will remain influenced by:
- Correlation with risk assets
- Global liquidity conditions
- Regulation (SEC, MiCA), no major event announced
CONCLUSION FOR THE WEEK OF MAY 18 TO 24, 2026
The central question of the week is no longer “how large will the shock be?” but “how long will it last?”
Three elements should structure market analysis for the days ahead:
1. Oil as the primary adjustment variable
The World Bank baseline scenario (86 $/barrel average in 2026) assumes a reopening of the Strait “by May.” As of May 18, this assumption has not materialised. The week will be marked by hour-by-hour monitoring of diplomatic and military announcements. Any signal of an extension of the closure would move the market toward the high scenario (95-115 $/barrel).
2. Agriculture between two timeframes
Spot agricultural prices will remain moderate, global cereal stocks are still comfortable. But the signal sent by fertilizer prices (+30% projected in 2026, +60% for urea) is setting the stage for tension on future harvests. The arbitrage for investors is between a very short-term short position and an expectation of price increases over 6-12 months.
3. Precious metals as a barometer of systemic risk
The projection of +42% for precious metals in 2026 is the highest of all asset classes covered by the World Bank. This single figure summarises the state of the world: safe-haven assets take precedence over any other allocation motive.
SOURCES
- UNCTAD, Global Trade Update, May 2026 (May 7, 2026)
- EIA (Energy Information Administration), Short-Term Energy Outlook (STEO), May 2026 (May 12, 2026)
- USDA (United States Department of Agriculture), World Agricultural Supply and Demand Estimates (WASDE), May 2026, First estimates for the 2026/2027 season (May 12, 2026)
- IEA (International Energy Agency), Oil Market Report (OMR), May 2026 edition (May 13, 2026)
- World Bank, Commodity Markets Outlook, May 2026 analysis (publications between May 7 and May 14, 2026)
- FAO (Food and Agriculture Organization), Food Price Index, April 2026 (May 8, 2026)
Note: This note is exclusively based on data published by international institutions between May 7 and May 18, 2026. No unverifiable or unsourced information is included. The projections mentioned are those of the cited institutions and do not constitute investment recommendations.
Important Disclaimer: The content of this article is provided for informational and educational purposes only. It reflects the author’s opinion based on information available at the time of publication, which may become outdated. This content does not constitute personalized investment advice, a recommendation to buy or sell, and does not guarantee future performance. Markets carry a risk of capital loss. The investor is solely responsible for their decisions and should consult an independent professional advisor before any transaction. The publisher disclaims all liability for decisions made based on this information.