
This note provides a comprehensive, sector-by-sector analysis of market dynamics for the week of May 26-31, 2026. Every assertion is based exclusively on official sources, central bank communications, and verified data published within the last 30 days.
Executive Summary: The Regime Has Changed
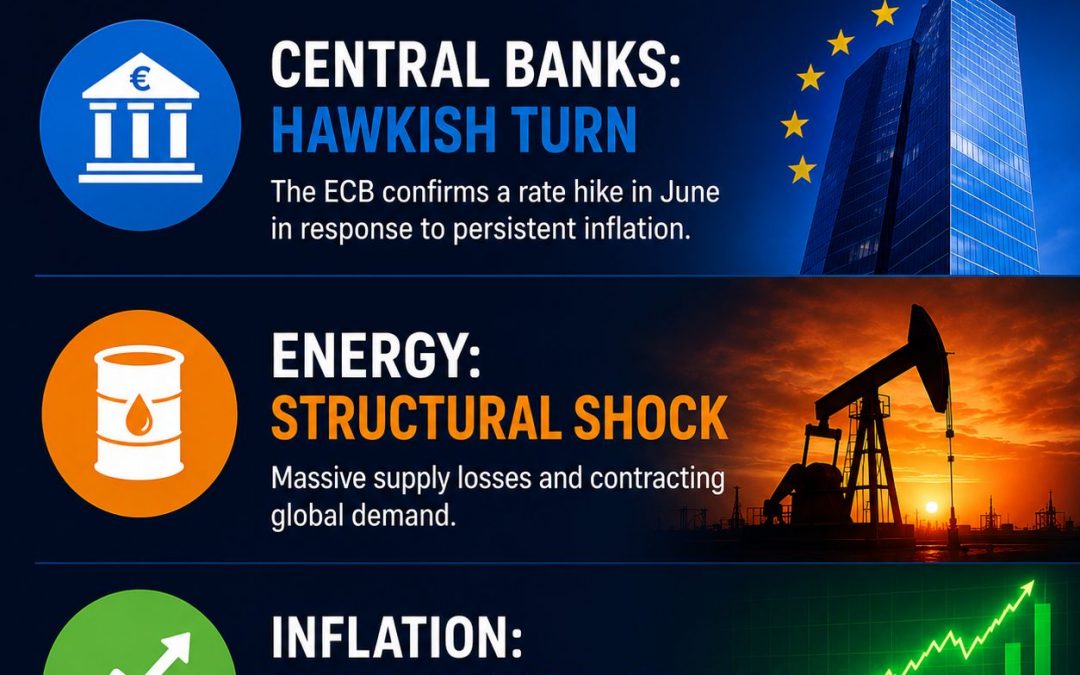
The week of May 26 marks a decisive shift in market expectations. Three developments converge, each representing a fundamental break from the assumptions that guided investors through the first quarter of 2026:
First, the European Central Bank has signaled, with unprecedented clarity for an institution known for its deliberate opacity, that a June rate hike is now inevitable. Executive Board members Isabel Schnabel and Philip Lane have explicitly indicated that a policy response is now necessary, moving substantially beyond the ECB’s March baseline scenario and, according to Schnabel, even beyond the “adverse” scenario that was previously considered a tail risk.
Second, the oil shock has become persistent rather than transitory. The International Energy Agency reports cumulative supply losses exceeding 1 billion barrels, with global oil demand now expected to contract by 420,000 barrels per day in 2026. This is not a temporary spike, it is a structural reconfiguration of global energy markets, with the Strait of Hormuz effectively closed since late February.
Third, inflation expectations are de-anchoring at shorter horizons, the classic precursor to a self-sustaining inflation spiral. The ECB’s Consumer Expectations Survey shows what Schnabel describes as a “fattening of the right tail” of the inflation distribution, an early warning indicator that households and businesses are beginning to expect higher inflation as a permanent feature of the economic landscape.
What this means for markets: Bond yields are rising across developed economies. Equities face a tug-of-war between resilient earnings and higher discount rates. Commodities remain the only clear hedge against persistent inflation. The week ahead will be defined by two critical data releases: the ECB’s May inflation flash estimate on Tuesday, June 2, and the US PCE data on Thursday, May 28.
Part I. Central Bank Policy : The Tectonic Shift
1.1 The ECB: From “Looking Through” to “Necessary Response”
The most significant development of the week comes from Frankfurt, and it demands careful unpacking. In two separate interviews published on May 26, ECB Executive Board members Isabel Schnabel (interviewed May 21) and Philip Lane (interviewed May 19) fundamentally recalibrated the ECB’s policy stance. Their language is worth quoting at length because it reveals not just their policy intent but their cognitive framework for understanding the current shock.
Isabel Schnabel’s Core Messages:
“Looking through is no longer an option in my view.” This phrase (“looking through”) is technical shorthand in central banking parlance for ignoring temporary supply shocks on the grounds that monetary policy cannot affect energy prices and should focus instead on demand conditions. The ECB’s doctrinal framework, refined over decades, holds that central banks should “look through” commodity price spikes when they are clearly temporary. Schnabel’s declaration that this is no longer possible represents a doctrinal shift of the first order.
“We have actually moved beyond the adverse scenario.” The ECB’s March 2026 projections included three scenarios: baseline (2.6% inflation, 0.9% growth), adverse (higher energy prices, worse outcomes), and severe. Schnabel now states that in terms of the persistence of the shock, not just its magnitude, but how long it is expected to last, the current situation exceeds the adverse scenario assumptions. This is striking: the “adverse scenario” was meant to capture a bad outcome; the ECB now judges that reality is worse than that bad outcome.
“A rate hike in June will be needed.” This is the most explicit pre-commitment the ECB has ever made outside a formal Governing Council statement. Schnabel is not saying “we may consider” or “it depends on the data.” She is saying a hike will be needed.
Inflation has already risen to 3% and is expected to reach 4% by year-end. The April 2026 inflation print, confirmed by Eurostat on May 20, showed HICP at 3.0% year-over-year, up from 2.6% in March. Energy prices surged 10.8% annually. Schnabel projects this will approach 4% by December, a trajectory that would put inflation at double the ECB’s 2% target for a sustained period.
The futures curve for oil now stands above the adverse scenario over longer horizons. Markets are no longer pricing a rapid normalization. They are pricing persistence, and the ECB is following.
Perhaps most remarkably, Schnabel stated that even a peace deal with Iran would not stop the rate hike. Her reasoning is critical: “Even if the war ended today, a lot of damage has already been done to energy infrastructure and global supply chains. So, even then, I believe that a monetary policy reaction would be needed”. This signals that the ECB believes the supply-side damage is structural, not reversible in the short term.
Philip Lane’s Complementary Analysis:
Lane, the ECB’s chief economist, provided a three-scenario framework for understanding the ECB’s reaction function :
| Scenario | Shock Characteristics | Policy Response |
| 1. Benign | Small and temporary | Look through it |
| 2. Medium | Persistent but medium-sized | Limited response, not full cycle |
| 3. Severe | Large and broadening | Stronger response needed |
Lane’s assessment of where we stand: “The longer the conflict continues, the less likely the most benign scenario becomes.” He confirmed that oil prices have remained above March projections, requiring a likely upward adjustment to inflation forecasts at the June 4-5 Governing Council meeting.
Lane also emphasized the importance of “indirect effects”, the mechanism by which higher energy prices spill over into the wider economy. “Our surveys suggest many firms expect that they will have to raise prices,” Lane said, adding that this could result in a “broader inflation problem” and “a major issue”.
The ECB’s Economic Bulletin (Issue 3, 2026), published May 14, provides the institutional backdrop:
Rates were kept unchanged at the April 30 meeting: the deposit facility remains at 2.00%, the main refinancing rate at 2.15%. However, the Governing Council noted that “upside risks to inflation and downside risks to growth have intensified.” The bulletin also observed that while longer-term inflation expectations remain anchored (a key condition for the ECB to avoid aggressive tightening) inflation expectations over shorter horizons have moved up significantly.
Market implications for the week ahead: The June 4-5 Governing Council meeting is now live. Markets are pricing two to three rate hikes for 2026, which would lift the deposit rate to 2.50-2.75%, the highest level since March 2025 . The question is no longer whether the ECB moves, but how aggressively, and whether the first move is 25 basis points or, in a scenario of extreme pressure, 50 basis points.
For the investor, the key insight is this: The ECB has crossed a psychological threshold. Having kept rates on hold for a year, it is now committed to tightening into a weakening economy. The last time the ECB raised rates into a slowdown was 2011, a decision it later reversed and regretted. The difference is that in 2011, the shock was sovereign debt; today, it is energy supply. The inflation pressures are more real, but the growth consequences are also more severe.
1.2 The Fed: Watching, Waiting, but Watching Very Closely
The US Federal Reserve’s position is more nuanced than the ECB’s, and the divergence matters for global asset allocation.
The next Personal Consumption Expenditures (PCE) inflation data will be released by the Bureau of Economic Analysis on Thursday, May 28, the most important data point of the week for US markets.
What we know going in:
April CPI (released May 15) showed headline inflation at 3.8% year-over-year, the highest level in three years, with a monthly increase of 0.6%. The CPI is the consumer-facing measure; it tells us what households are actually paying.
April PPI (released May 14) surged by 1.4% from the prior month, far exceeding the market forecast of 0.5%. The Producer Price Index measures costs at the wholesale level (what businesses are paying for inputs). A PPI surge of this magnitude typically precedes higher consumer inflation by two to three months as businesses pass through costs.
March Core PCE (the most recent available before Thursday) stood at +3.2% year-over-year. The trajectory of core PCE over recent months has been: December 3.0%, January 3.1%, February 3.0%, March 3.2%.
What economists expect for April: According to the Financial Times, economists expect core inflation to have risen to 3.4% year-over-year, which would be the highest level since mid-2023. The Federal Reserve Bank of Cleveland’s Inflation Nowcasting model estimates that headline PCE inflation increased to 3.73% in April and could rise further to 3.93% in May. Core PCE is expected to remain elevated at roughly 3.28% in April and 3.32% in May.
The Fed’s dilemma, laid out clearly:
Unlike the ECB, which faces a pure import shock over which it has no control, the Fed benefits from relative US energy independence. The United States is a net exporter of natural gas and a major oil producer. The pass-through of global oil prices to US inflation is therefore less direct and less severe than in Europe.
However, the Fed cannot ignore global inflation pressures entirely. If core PCE remains above 3%, and especially if it accelerates to 3.4% as expected, the case for patience weakens considerably. The Fed’s current stance, articulated in the May FOMC statement, is that recent inflationary pressures are “temporary.” The April PCE data will serve as evidence for or against this claim.
The consumer sentiment backdrop: The University of Michigan’s consumer sentiment index released this month came in even lower than the historic low recorded in June 2022. Consumers are feeling the pinch of higher prices at the gas pump and the grocery store, and their expectations for future inflation have risen accordingly.
For the investor, the key insight is this: The Fed and the ECB are on diverging paths, but both are facing the same underlying reality that the energy shock is persistent, and it is feeding into core inflation. The ECB is moving first and more aggressively because its exposure is greater. The Fed is watching and waiting, but if Thursday’s PCE data confirms an acceleration, the “waiting” phase will end quickly.
1.3 The Central Bank Divergence: What It Means for Currencies and Capital Flows
The policy divergence between the ECB (tightening into weakness) and the Fed (holding steady, potentially cutting later) has profound implications for exchange rates and cross-border capital flows.
The euro-dollar dynamic: If the ECB raises rates in June while the Fed holds steady, the interest rate differential narrows, which typically supports the euro against the dollar. However, this is not a straightforward trade. The euro is also a cyclical currency. It weakens when European growth underperforms. With euro area growth now projected at just 0.9% for 2026, the cyclical headwind against the euro is substantial. The net effect is ambiguous.
Emerging market exposure: According to UNCTAD, the Hormuz disruption is hitting emerging economies through multiple channels. Since the escalation in late February, currencies have weakened by 2.9% in Africa, 2.3% in Latin America and the Caribbean, and 1.0% in developing Asia and Oceania. External sovereign bond yields have risen by 0.64 percentage points in Africa, 0.36 points in Latin America, and 0.70 points in developing Asia.
The 3.4 billion figure: UNCTAD notes that 3.4 billion people live in 46 developing countries that already spend more on servicing debt than on health or education. These economies had very little room to absorb another shock even before the Hormuz closure. The current crisis is landing on an already fragile foundation.
For the investor, this means: Emerging market debt and currencies face significant headwinds. The traditional “risk-on, risk-off” trade is complicated by the fact that the shock is supply-side, not demand-side. Countries that are net energy importers (most of emerging Asia, parts of Latin America) are particularly vulnerable.
Part II. Energy Markets : The Unprecedented Supply Shock
2.1 The IEA’s May 2026 Oil Market Report: The Numbers That Matter
The International Energy Agency’s May 2026 Oil Market Report, published in mid-May, provides the most authoritative assessment of the global oil market available to investors this week. The data are stark, and they demand careful attention.
Supply Collapse: The Headline Numbers
| Indicator | Value | Significance |
| Global oil supply (April 2026) | 95.1 million barrels per day | Down 1.8 mb/d from March |
| Total losses since February | 12.8 mb/d | Largest disruption in history |
| Gulf countries’ output below pre-war | 14.4 mb/d | The core of the shock |
| Cumulative supply losses | >1 billion barrels | Equivalent to more than 1% of annual global demand |
Understanding the 14.4 mb/d figure: Before the conflict, Gulf producers (Saudi Arabia, UAE, Kuwait, Qatar, Iraq, and others) were producing approximately 28-30 mb/d. The closure of the Strait of Hormuz (through which approximately 20 mb/d of oil and 30% of global LNG trade passed) has effectively shut in nearly half of that production. Some exports have been rerouted through alternative ports (Saudi Arabia’s west coast, Fujairah in the UAE, the Iraq-Turkey pipeline), but these alternatives have limited capacity.
Demand Destruction: The Symmetric Shock
The surprise in this crisis, and the reason traditional oil market models are failing, is that the supply shock is already causing demand destruction. The IEA’s forecast:
| Metric | Value | Change from Pre-War Forecast |
| Global oil demand 2026 | 104 mb/d | -1.3 mb/d |
| Year-over-year change | -420,000 b/d | First contraction since 2020 |
| Q2 2026 demand decline | -2.45 mb/d vs 2025 | Steepest quarterly drop on record |
Where demand is falling hardest:
- Petrochemical feedstocks (LPG/ethane and naphtha): Account for roughly half of the 2026 demand downgrade. These are industrial inputs; their decline signals a broader manufacturing slowdown.
- Jet fuel and kerosene: Demand has weakened sharply as airlines reduce flights in response to higher fuel costs and disruptions across Gulf aviation hubs. Dubai, Doha, and Abu Dhabi (major global transit points) have seen traffic collapse.
- OECD countries: -930,000 b/d in Q2. The developed world is feeling the pinch at the pump and in industrial activity.
- Non-OECD economies: -1.5 mb/d in Q2. Emerging markets, which are often more energy-intensive and have fewer social safety nets, are being hit even harder.
Inventories: The Buffer Is Gone
Global oil inventories are the buffer between supply and demand. When inventories are high, prices are stable. When inventories are low, prices become volatile. The IEA’s inventory data is alarming:
| Period | Inventory Change | Cumulative Draw |
| March 2026 | -129 mb | -129 mb |
| April 2026 | -117 mb | -246 mb |
| April on-land inventories (alone) | -170 mb | – |
The 250 million barrel draw: Over March and April, global inventories drew down by approximately 250 million barrels. The IEA notes that continued disruptions to seaborne trade through the Strait contributed to a 170 million barrel decline in on-land inventories during April alone, while “oil on water” (tankers at sea, waiting or diverted) increased by 53 million barrels.
What “oil on water” means: When tankers cannot transit the Strait, they either wait (if they believe transit will resume) or take long alternative routes around Africa (adding 30-40 days to journey times). Oil that is on water is oil that is not yet available to refineries. This creates a lag between supply and availability, exacerbating price volatility.
Refining: The Hidden Bottleneck
Global refinery crude throughputs are expected to plunge by 4.5 mb/d in Q2 2026 to 78.7 mb/d, and decline by 1.6 mb/d to 82.3 mb/d for the full year. Refiners are contending with infrastructure damage, export restrictions, and lower feedstock availability.
Despite lower refinery runs, refining margins remained at historically high levels, supported by record middle distillate crack spreads. In plain English: even as refineries process less oil, the products they do produce (diesel, heating oil, jet fuel) are selling at enormous premiums to crude because of scarcity. This is a classic sign of a supply-driven shock.
Prices: The Volatility Story
North Sea Dated crude averaged $120.36 per barrel in April, up $16.50 month-over-month. The trading range in April was nearly $50 per barrel, from below $100 to $144. At the time of the International Energy Agency report’s publication in mid-May, prices had moderated to around $110 per barrel, but volatility remains extreme.
The IEA’s critical insight worth quoting in full:
“More than ten weeks after the war in the Middle East began, mounting supply losses from the Strait of Hormuz are depleting global oil inventories at a record pace… With Hormuz tanker traffic still restricted, cumulative supply losses from Gulf producers already exceed 1 billion barrels with more than 14 mb/d of oil now shut in, an unprecedented supply shock.”
The forward outlook: The IEA assumes a gradual resumption of flows through the Strait beginning in June. However, the agency warns that “supply will likely be slower to recover than demand.” The market is expected to remain in deficit until the fourth quarter of 2026, likely fueling further price swings ahead of the peak summer demand period.
For the investor, the key insight is this: The oil market has moved from a “normal” supply-demand equilibrium to a regime of physical disconnection. Traditional models that rely on price elasticity of supply and demand are temporarily invalid. The only reliable indicator is physical inventory levels, and they are flashing red.
2.2 The Strait of Hormuz Disruption: UNCTAD’s Comprehensive Assessment
The UN Trade and Development agency (UNCTAD) has been tracking the ripple effects of the Hormuz closure with increasing alarm. Their latest assessment, updated May 13, 2026, provides the macro context that every investor needs to understand.
The Magnitude of the Disruption:
| Metric | Pre-Conflict (Feb 1-27) | Post-Conflict (Mar 1-29) | Change |
| Average daily ship transits | 129 | 6 | -95% |
| Strait status | Open | “Practically closed” | – |
The waterway remains “practically closed” as of mid-May, according to UNCTAD. This is a sustained blockade of one of the world’s most critical chokepoints.
Trade Growth Downgrade: The Numbers That Matter for Global GDP
| Scenario | 2026 Merchandise Trade Growth | Comparison to 2025 |
| Best-case | +2.5% | Down from 4.7% in 2025 |
| Worst-case | +1.5% | Down from 4.7% in 2025 |
UNCTAD’s assessment: “What began as a disruption in a key corridor for energy products is now spreading to the entire global economy”.
Global GDP impact: UNCTAD expects global GDP growth of 2.6% in 2026, a significant deceleration from pre-conflict expectations. For mature economies, growth is now estimated at +1.5% (down from previous forecasts). For emerging economies, the forecast is now 4.1% (down from 4.2%).
The Transmission Channels: How the Shock Spreads
Channel 1: Energy Prices. This is the primary channel. Higher oil and gas prices increase production costs across every sector of the economy.
Channel 2: Fertilizers. The Strait of Hormuz transports significant volumes of LNG, which is a key input for nitrogen fertilizer production. Fertilizer prices are rising, which will eventually translate into higher food prices.
Channel 3: Maritime Transport Costs. The dirty tanker index (for crude oil) stands at 215 and the clean tanker index (for refined products) at 188, using February 27, 2026 as the baseline of 100. Shipping costs have more than doubled for some routes.
Channel 4: Container and Dry Bulk Shipping. Even segments less directly hit by the Hormuz closure are seeing cost increases due to longer routes, higher insurance, and general uncertainty.
The Developing Country Dimension: 3.4 Billion People at Risk
UNCTAD’s most sobering statistic: 3.4 billion people live in 46 developing countries that already spend more on servicing debt than on health or education. These economies had no fiscal space before the crisis. Now they face :
- Currency weakness: Since the escalation, currencies have weakened by 2.9% in Africa, 2.3% in Latin America and the Caribbean, and 1.0% in developing Asia. Weaker currencies make imports (fuels and food) more expensive.
- Higher borrowing costs: External sovereign bond yields have risen by 0.64 percentage points in Africa, 0.36 points in Latin America and the Caribbean, and 0.70 points in developing Asia and Oceania since February 27.
- Capital flight: Investors are moving away from riskier assets, selling stocks, bonds, and currencies related to developing countries. The sales have been more pronounced than those seen in advanced economies.
UNCTAD’s policy recommendations: The report calls for measures to stabilize prices, contain spillover across energy, trade and finance, and improve access to emergency funding for vulnerable countries. Specific steps include emergency external financing for essential imports and debt servicing, loans from development banks, debt relief, central bank currency swaps, and regional financial assistance.
For the investor, the key insight is this: The emerging market debt and currency trade is not monolithic. Countries that are net energy exporters (some in the Gulf, parts of Africa, Latin America) may benefit from higher oil prices, though they also face disruption costs. Countries that are net energy importers (most of Asia, many in Africa, Eastern Europe) face a triple whammy of higher import costs, weaker currencies, and tighter financial conditions.
Part III. Inflation Dynamics: From Energy to Core, From Temporary to Persistent
3.1 The Euro Area: The Pass-Through Has Begun, and It Is Accelerating
The confirmed April inflation data, published by Eurostat on May 20, provides the baseline for the week ahead:
Eurozone HICP (Harmonized Index of Consumer Prices) accelerated to 3.0% year-over-year in April, up from 2.6% in March. This matched the flash estimate published on April 30. Core inflation (excluding energy, food, alcohol, and tobacco) softened slightly to 2.2% in April, down from 2.3% in March.
The composition matters enormously:
| Component | Annual Change | Contribution |
| Energy | +10.8% | The primary driver |
| Services | +3.0% | Strong, showing second-round effects |
| Food, alcohol, tobacco | +2.4% | Rising |
| Non-energy industrial goods | +0.8% | Muted but accelerating |
On a monthly basis, the HICP climbed 1.0% in April, an extraordinarily rapid pace that, if sustained, would imply annual inflation well above 12%. The monthly figure captures the immediacy of the shock.
Why core inflation softened while headline accelerated: This seems counterintuitive but is actually diagnostic. Core inflation (excluding energy) softened from 2.3% to 2.2% because the energy shock was so sudden and severe that it has not yet fully passed through to other prices. The lag between energy price increases and their translation into core inflation is typically three to six months. The softening of core inflation in April is is the calm before the storm.
Isabel Schnabel’s assessment of where we stand, as of May 26:
Schnabel predicts that inflation is “going to rise further” towards 4% at the end of the year. She stated that we are already seeing “increasing signs that the shock is spilling over to other parts of the consumption basket”.
The three indicators Schnabel monitors closely:
First, firms’ selling price expectations. The European Commission’s survey shows a sharp increase across sectors in the share of firms planning to raise selling prices over the next three months. Schnabel notes this increase is “faster than in 2022”, and 2022 was the peak of the post-pandemic inflation surge.
Second, inflation expectations from consumers and businesses. Short-term expectations have risen sharply. More worrisome: the ECB’s Consumer Expectations Survey shows “a bit of a fattening of the right tail of the distribution.” In plain English, more people now expect very high inflation than before. This is an early indicator that “the risk of a de-anchoring of inflation expectations is increasing”.
Third, wages. Wage data arrive with lags, but forward-looking indicators show a slight upward revision in wage growth expectations. If wages begin to catch up with energy inflation, the price-wage spiral becomes a real possibility.
Philip Lane’s complementary warning:
“Our surveys suggest many firms expect that they will have to raise prices,” Lane said. He warned that this could result in a “broader inflation problem” and “a major issue”.
The ECB’s March baseline projection: HICP at 2.6% for 2026. Schnabel now indicates that actual inflation has already reached 3% (confirmed) and is expected to approach 4% by year-end. Lane confirms that “we are likely to make a further upward adjustment to the inflation forecast in June”.
For the investor, the key insight is this: The ECB’s doctrinal framework (that it can “look through” energy shocks because they are temporary) is being abandoned because the shock is no longer temporary. The risk of second-round effects (price-wage spirals) is no longer theoretical; it is visible in survey data. This is the most hawkish the ECB has sounded since the 2022 inflation crisis, and it has direct implications for bond yields, equity valuations, and currency markets.
3.2 The United States: Waiting for the PCE Release, Braced for an Upside Surprise
The US inflation picture is different from Europe’s, but not necessarily better.
The BEA will release April PCE data on Thursday, May 28. This is the Fed’s preferred inflation measure, and it will be scrutinized with an intensity that is difficult to overstate.
What we know from April CPI and PPI (already released):
| Indicator | Actual | Forecast | Prior |
| April CPI (YoY) | 3.8% | ~3.5% | 3.5% (March) |
| April CPI (MoM) | 0.6% | ~0.3% | 0.2% (March) |
| April PPI (MoM) | 1.4% | 0.5% | -0.4% (March) |
The April CPI was the highest in three years. The monthly increase of 0.6% is particularly concerning because it suggests momentum, not just base effects. The April PPI surge of 1.4% month-over-month far exceeded even the most pessimistic forecasts.
What economists expect for April PCE:
According to the Financial Times, economists expect core PCE (excluding food and energy) to have risen to 3.4% year-over-year in April, which would be the highest level since mid-2023.
The Cleveland Fed’s nowcasting model provides a more granular estimate:
| Metric | April Estimate | May Estimate |
| Headline PCE | 3.73% | 3.93% |
| Core PCE | 3.28% | 3.32% |
| Q2 annualized PCE | >5% | – |
| Q2 core PCE | 3.46% | – |
The Cleveland Fed’s model estimates that second-quarter annualized PCE inflation is running over 5%, a rate that would be extremely uncomfortable for the Fed.
What this means for the Fed’s “transitory” narrative:
The Fed has maintained that recent inflationary pressures are “temporary,” a word that carries enormous baggage from the 2021-2022 period when the Fed famously misjudged inflation as transitory. The April data (CPI at 3.8%, PPI surging 1.4%, core PCE expected at 3.4%) challenge that narrative directly.
The consumer sentiment context:
The University of Michigan’s consumer sentiment index, released this month, came in even lower than the historic low recorded in June 2022. American consumers are more pessimistic now than they were at the depths of the post-pandemic inflation crisis. This pessimism is driven by rising prices at the gas pump and the grocery store, and by expectations that prices will continue to rise.
For the investor, the key insight is this: The US inflation story is not as severe as Europe’s (the energy shock is less direct because the US is a net energy exporter), but it is moving in the same direction. Thursday’s PCE release will either validate the Fed’s patience or force a reassessment. The consensus expectation is for an acceleration to 3.4% core PCE. If the actual number comes in higher, markets will reprice Fed expectations immediately.
Part IV. Bond Markets: The Yield Reset Has Begun
4.1 Euro Area: Rising Term Premia and the End of “Low for Long”
Schnabel addressed the recent bond market sell-off directly in her May 26 interview, and her diagnosis is critical for understanding where yields are headed:
“The increase in bond yields in the euro area is mainly driven by an increase in inflation compensation. And this partly reflects an increase in inflation risk premia owing to heightened uncertainty about the future inflation outlook”.
Translating Schnabel’s language:
“Bond yields” are what investors earn for lending money to governments. “Inflation compensation” is the portion of bond yields that reflects expected future inflation. “Inflation risk premia” is an extra cushion that investors demand because they are uncertain about future inflation. it’s an insurance premium against the risk that inflation surprises to the upside.
Schnabel’s critical observation: Ten-year real rates have remained stable. The entire move in bond yields (the sell-off that has pushed European government bond yields higher over the past month) is about inflation expectations, not about real growth expectations.
What this means: The market is not selling bonds because it expects stronger growth (which would be a normal cyclical reason for yields to rise). It is selling bonds because it expects higher inflation. This is a more dangerous dynamic because it implies that the bond market is losing confidence in the ECB’s ability to control inflation.
Schnabel’s assessment of sovereign spreads:
“I don’t see any concerning developments in euro area sovereign bond markets.” She noted that the Transmission Protection Instrument (TPI) (the ECB’s backstop facility to prevent “unwarranted” spread widening) remains available, though she hopes “it is not going to be used”.
What this means in practice: Italian, Spanish, and French bond yields have widened relative to German bunds, but the ECB judges this widening as “warranted” (reflecting fundamentals) rather than “unwarranted” (speculative attack). The TPI would only be triggered if spreads widened beyond what fundamentals justify.
Market pricing for ECB rate hikes:
Investors are currently pricing in two quarter-point rate hikes this year, which would lift the deposit rate to 2.50%. Some see a roughly 50% chance of a third move over the next year. Economists are more cautious, seeing just two hikes followed by a cut in mid-2027.
Schnabel’s hint on the number of hikes:
Schnabel pointed out that the ECB’s own baseline projection incorporated market expectations of two rate hikes. This suggests that the ECB’s internal forecasts assume two hikes. It does not rule out a third, but it suggests that two is the baseline.
For the investor, the key insight is this: European bond yields are repricing to reflect a world of higher and more persistent inflation. The 10-year German bund yield, which spent much of the past decade below zero, is now positive and rising. This has profound implications for all asset classes, because the risk-free rate is the foundation upon which all other asset valuations are built.
4.2 US Treasuries: Following the Inflation Signal, Awaiting the PCE Release
US Treasury yields are moving in sympathy with European developments, but the Fed’s slower reaction function and the relative energy independence of the US economy means the Treasury market remains less volatile than its European counterparts.
The key dynamic: If Thursday’s PCE release shows core inflation at 3.4% or higher, Treasury yields will likely rise across the curve as markets price in a higher probability of Fed tightening. If core inflation comes in below expectations, yields may stabilize or fall modestly.
The real yields story: Unlike in Europe, where real rates have remained stable, US real rates have also risen modestly, reflecting not just inflation expectations but also some reassessment of growth prospects. The US economy’s relative strength (GDP growth revised to 2.3% for 2026) supports higher real rates.
For the investor, the key insight is this: The Treasury market is waiting for the PCE data. The week ahead is likely to be quiet until Thursday, then volatile after the release. Positioning ahead of the number is the key tactical question.
Part V. Equity Markets: Earnings Resilience vs. Higher Discount Rates
5.1 The Fundamental Tension: Good Earnings, Bad Discount Rates
Equity markets face a fundamental tension that is likely to define the trading environment for the rest of 2026.
On one side: resilient earnings. Corporate profits, particularly in the US, have held up better than expected. The AI boom is a genuine demand shock for semiconductors, data centers, and related infrastructure. Energy companies are benefiting from higher oil prices. Defense contractors are seeing increased demand.
On the other side: higher discount rates. The risk-free rate (government bond yields) is rising. The equity risk premium (the extra return investors demand for holding stocks instead of bonds) may also be rising as uncertainty increases. Higher discount rates reduce the present value of future earnings, putting downward pressure on stock prices.
The net effect: Equities are likely to remain range-bound, with sectoral dispersion replacing broad market direction. Investors will need to be selective.
5.2 Sectoral Analysis: Winners and Losers from the Current Regime
Energy: Clear winner. Oil prices at $110-130 per barrel translate into record profits for integrated oil companies and pure-play E&P firms. The caveat: demand destruction is real, and if demand falls faster than prices rise, volumes matter. But for now, the energy sector is the most direct hedge against the current shock.
Defense: Structural winner. SIPRI data shows global military expenditure reached $2.718 trillion in 2024, up 9.4% in real terms, the largest annual increase since the end of the Cold War. European defense spending is accelerating. Defense contractors benefit from both higher volumes and pricing power.
Semiconductors: Complex picture. The AI boom drives demand for advanced chips (Nvidia GPUs, specialized AI accelerators). But semiconductor manufacturing is energy-intensive, and higher energy costs pressure margins. The sector also faces geopolitical risks (Taiwan, South Korea). Winners: companies with pricing power and diversified manufacturing. Losers: commodity chip producers with thin margins.
Renewable energy: Structural beneficiary of high fossil fuel prices. Solar, wind, and battery storage become more competitive as oil and gas prices rise. However, renewable projects also face higher input costs (metals, logistics, financing). The net effect is positive but less dramatic than a simple “oil up, renewables up” narrative would suggest.
Airlines and transport: Clear losers. Jet fuel prices have surged, and demand is falling as flights are canceled and business travel declines. Airlines face a double squeeze: higher costs and lower demand. Cargo carriers face similar pressures.
Consumer discretionary: Negative. Higher energy prices act as a tax on disposable income. Consumers have less money to spend on discretionary items (restaurants, travel, entertainment). The University of Michigan’s consumer sentiment reading (below the historic low of June 2022) confirms the pessimism.
Financials: Mixed. Banks benefit from higher interest rates (wider net interest margins) but face higher credit risk as the economy slows. The yield curve (the spread between long and short rates) remains relatively flat, which is not ideal for bank profitability. Insurance companies face claims inflation but also benefit from higher investment income.
5.3 The AI Valuation Question
The AI trade has been one of the most crowded in market history. The question for the week ahead: can AI valuations withstand higher discount rates?
The bull case: AI is a genuine productivity-enhancing technology with decades of growth ahead. The transition from training to inference (from building AI models to running them) is still in its early stages. Companies that provide the infrastructure (semiconductors, cloud computing, data centers) have pricing power and visible growth.
The bear case: AI stocks have been valued as if the technology will transform the economy overnight. Higher discount rates punish long-duration assets, stocks whose value depends on earnings far in the future. Many AI stocks are long-duration assets. The rotation from growth to value that typically accompanies rising rates could hit AI stocks hard.
The middle ground: Not all AI stocks are created equal. Companies with current earnings (not just future promises) and pricing power will fare better. Companies that are still burning cash with promises of future profitability will face the most pressure.
Part VI. Currency Markets: The Divergence Trade
6.1 The Euro-Dollar Dynamic
The ECB-Fed policy divergence is the dominant theme in currency markets. Two forces pull in opposite directions:
Euro-supportive factors:
- ECB rate hikes (expected June and September) narrow the interest rate differential with the US.
- If the ECB tightens into weakness, it signals commitment to the inflation target, which could boost confidence in the euro.
Euro-negative factors:
- Euro area growth is weaker (0.9% vs US 2.3%).
- The euro is a cyclical currency; it weakens when European growth underperforms.
- The energy shock is more severe for Europe, which is a net energy importer.
The net: The euro is likely to remain range-bound, trading in a $1.05-1.12 range against the dollar, with occasional spikes driven by policy announcements.
6.2 Emerging Market Currencies: The Vulnerability
The UNCTAD data on emerging market currency weakness is stark:
| Region | Currency Depreciation Since Feb 27 |
| Africa | -2.9% |
| Latin America & Caribbean | -2.3% |
| Developing Asia & Oceania | -1.0% |
Emerging market currencies face multiple headwinds: higher US and European rates (capital outflows), higher oil import bills (worsening trade balances), and risk aversion (investors fleeing to safe havens).
The selective opportunity: Not all emerging markets are equal. Net energy exporters (Brazil, some Gulf states, parts of Africa) may benefit from higher oil prices. Net energy importers (India, Turkey, most of Southeast Asia, Eastern Europe) are most vulnerable.
Part VII. The Week Ahead
Tuesday, June 2: Eurozone May Inflation Flash Estimate
What it is: Eurostat’s flash estimate of HICP for May 2026. This is the first look at whether April’s 3.0% inflation was a one-off or the beginning of a trend.
Why it matters: The ECB’s June 4-5 meeting is the next event. A high May inflation print would lock in a June rate hike. A moderate print would still leave the door open but would reduce pressure.
Expected: Economists polled by Reuters expect inflation to remain at 3.0% in May, the same level as April.
Thursday, May 28: US PCE Data (April 2026)
What it is: The BEA’s release of Personal Consumption Expenditures data for April, including core PCE.
Why it matters: The Fed has maintained that recent inflationary pressures are “temporary.” The April PCE data will serve as evidence for or against this claim. If core PCE accelerates to 3.4% as expected, the “temporary” narrative becomes harder to sustain.
Expected: Core PCE at 3.4% year-over-year (consensus). The Cleveland Fed’s nowcasting model suggests headline PCE at 3.73%.
Ongoing: Iran Peace Talks
What it is: The US has signaled progress in peace talks with Iran. The market is watching for any announcement of a deal that would allow Hormuz flows to resume.
Why it matters: Even if a deal is struck, Schnabel has stated that the ECB would still hike in June because “a lot of damage has already been done to energy infrastructure and global supply chains.” However, a deal would likely reduce oil prices significantly, which would ease inflation pressure and reduce the number of rate hikes priced into markets.
Part VIII. Strategic Implications for Different Investors
For Fixed Income Investors
The ECB is hiking into a slowdown. This is the classic stagflationary policy dilemma. The base case: two hikes in 2026 (June and September), then a pause. The risks are asymmetric: more hikes if inflation accelerates, but the market has already priced two hikes. German bunds offer negative real yields but are the safe haven in Europe. Italian BTPs offer higher yields but carry spread risk.
For US Treasuries: The PCE release on Thursday is the catalyst. If core PCE comes in at 3.4% or higher, expect yields to rise across the curve. If it comes in below 3.2%, yields may rally. The 10-year Treasury yield is the anchor for global risk-free rates; its movement matters for all assets.
For Equity Investors
Sector selection matters more than market timing. Energy, defense, and select AI infrastructure names are best positioned. Consumer discretionary, airlines, and highly leveraged growth stocks are most vulnerable. The rising discount rate environment favors value over growth.
For Commodity Investors
Oil remains the most direct hedge. The IEA projects market deficits until Q4 2026. Even if a peace deal is struck, supply will recover slowly. Gold also offers protection against inflation and geopolitical risk, though its trajectory is complicated by rising real rates.
For Currency Investors
The euro-dollar range trade is the most liquid expression of the policy divergence. Emerging market currencies face headwinds, but selective opportunities exist in net energy exporters.
Conclusion: The New Regime
The week of May 26, 2026 is a week of recognition. Markets and policymakers are recognizing that the energy shock that began in late February is not transitory. It is persistent. It is structural. It is changing the regime.
The ECB has recognized this fact and is preparing to act. Schnabel’s interview on May 26 was a pre-commitment. The June rate hike is now all but certain.
The Fed is still waiting, but Thursday’s PCE data may force its hand. If core inflation has accelerated to 3.4%, the “temporary” narrative will fray.
The oil market has recognized the persistence of the shock. Inventories are being drawn down at a record pace. The IEA projects deficits until Q4.
The bond market has recognized the implications. Yields are rising because inflation compensation is rising. Real rates are stable for now.
The equity market has not yet fully recognized the implications. Valuations still reflect the low-rate, low-inflation world of the past decade. The repricing may have further to go.
For the serious investor, the message is clear: the old playbook is obsolete. The new regime demands new thinking. Energy security is economic security. Inflation persistence is the new risk. And the central banks that were once your friends may now be your counterparties.
Important Disclaimer: The content of this article is provided for informational and educational purposes only. It reflects the author’s opinion based on information available at the time of publication, which may become outdated. This content does not constitute personalized investment advice, a recommendation to buy or sell, and does not guarantee future performance. Markets carry a risk of capital loss. The investor is solely responsible for their decisions and should consult an independent professional advisor before any transaction. The publisher disclaims all liability for decisions made based on this information.
Sources
| European Central Bank | Schnabel interview (Reuters) | May 26, 2026 |
| European Central Bank | Lane interview (Nikkei/FT) | May 26, 2026 |
| International Energy Agency | Oil Market Report (May 2026) | Mid-May 2026 |
| UNCTAD | Hormuz Disruption Assessment | May 13, 2026 |
| UNCTAD | Trade Growth Update | May 16, 2026 |
| Eurostat | April 2026 HICP Final Data | May 20, 2026 |
| ECB | Statistical Release Calendar | March 2026 |
| The Asia Business Daily | US PCE Preview | May 26, 2026 |
| Yahoo Finance/Reuters | Schnabel Interview (Full) | May 26, 2026 |
| Oil & Gas Journal | IEA Report Coverage | May 13, 2026 |
| CE Energy News | IEA Report Coverage | May 12, 2026 |
| World Ports Org | UNCTAD Coverage (May 12) | May 12, 2026 |
| World Ports Org | UNCTAD Coverage (May 16) | May 16, 2026 |
| Finanzen.at | Eurostat Inflation | May 20, 2026 |
| Yahoo Finance | US Inflation Tracker | May 9, 2026 |